 4
4peptides
spectra
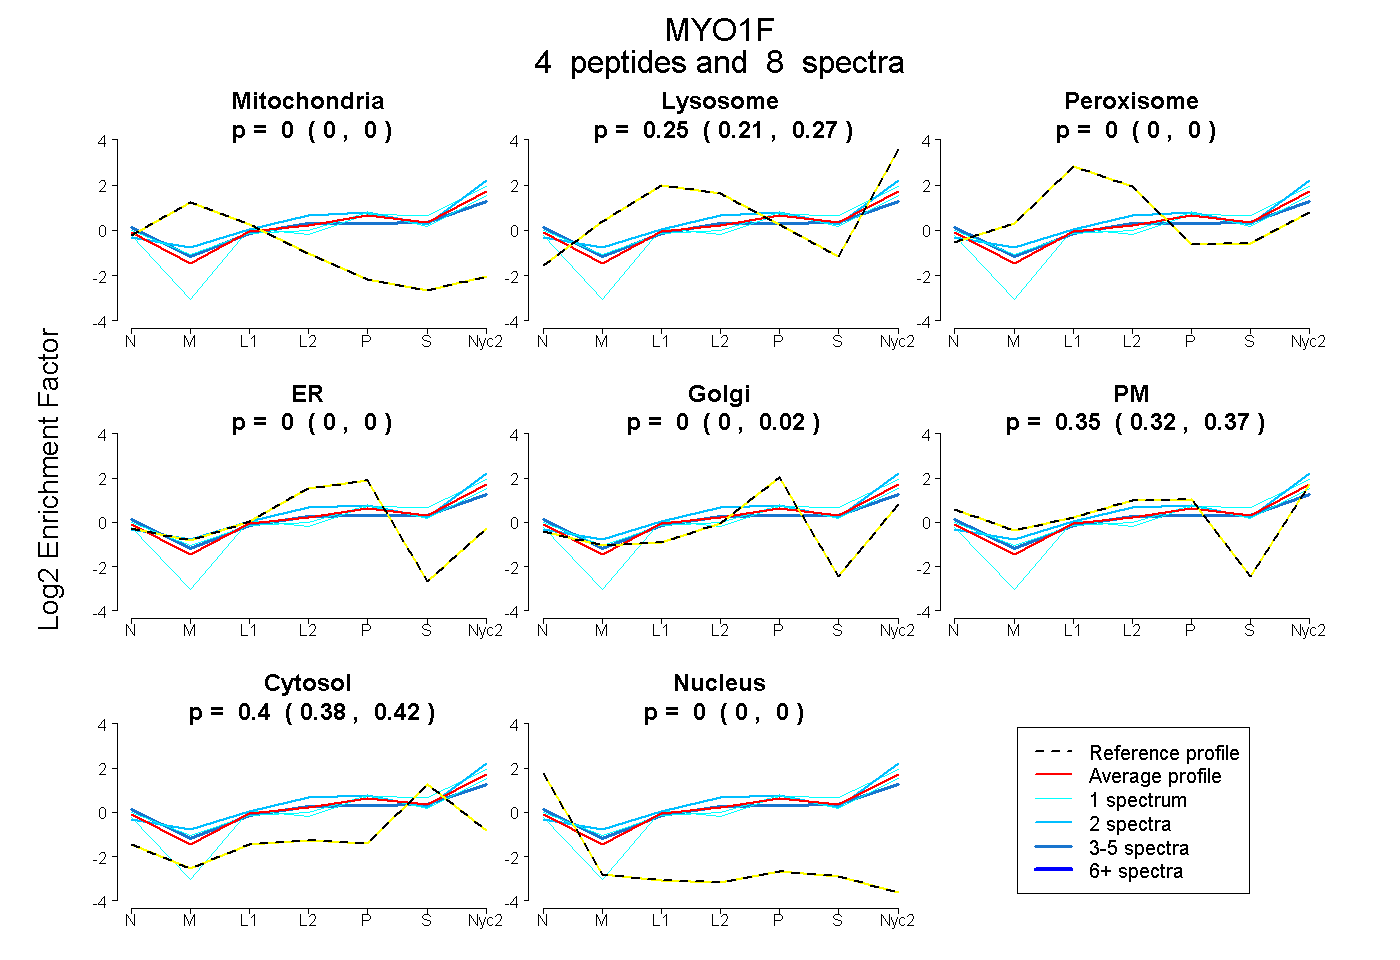
0.000 | 0.000
0.214 | 0.272
0.000 | 0.000
0.000 | 0.000
0.000 | 0.016
0.323 | 0.373
0.379 | 0.418
0.000 | 0.000
| Plot | Mito | Lyso | Perox | ER | Golgi | PM | Cytosol | Nucleus | |||||
| Expt A |
4 peptides |
8 spectra |
|
0.000 0.000 | 0.000 |
0.245 0.214 | 0.272 |
0.000 0.000 | 0.000 |
0.000 0.000 | 0.000 |
0.000 0.000 | 0.016 |
0.355 0.323 | 0.373 |
0.400 0.379 | 0.418 |
0.000 0.000 | 0.000 |
| 1 spectrum, GPPSSTLGASR | 0.000 | 0.255 | 0.000 | 0.000 | 0.105 | 0.143 | 0.497 | 0.000 | ||
| 4 spectra, GLAQGRPR | 0.000 | 0.166 | 0.024 | 0.000 | 0.000 | 0.392 | 0.418 | 0.000 | ||
| 1 spectrum, SLPMEITSGR | 0.000 | 0.199 | 0.000 | 0.000 | 0.045 | 0.381 | 0.374 | 0.000 | ||
| 2 spectra, QGVQHLLR | 0.000 | 0.398 | 0.000 | 0.000 | 0.025 | 0.277 | 0.301 | 0.000 |
| Plot | Lyso | Other | |||||||||||
| Expt C |
3 peptides |
6 spectra |
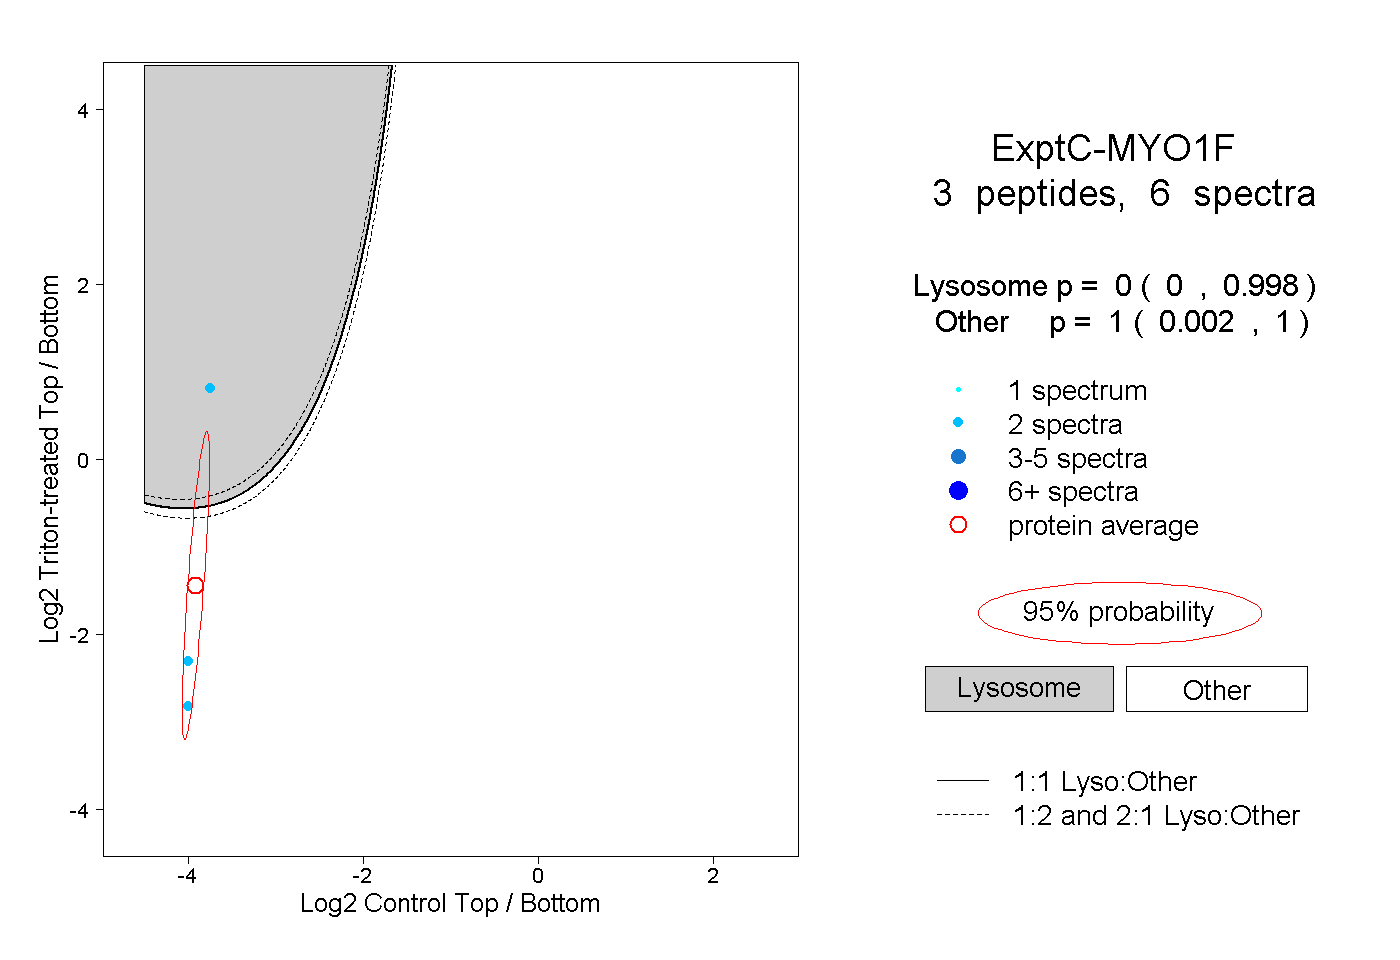 |
0.000 0.000 | 0.998 |
1.000 0.002 | 1.000 |
||||||||
| Plot | Lyso | Other | |||||||||||
| Expt D |
1 peptide |
2 spectra |
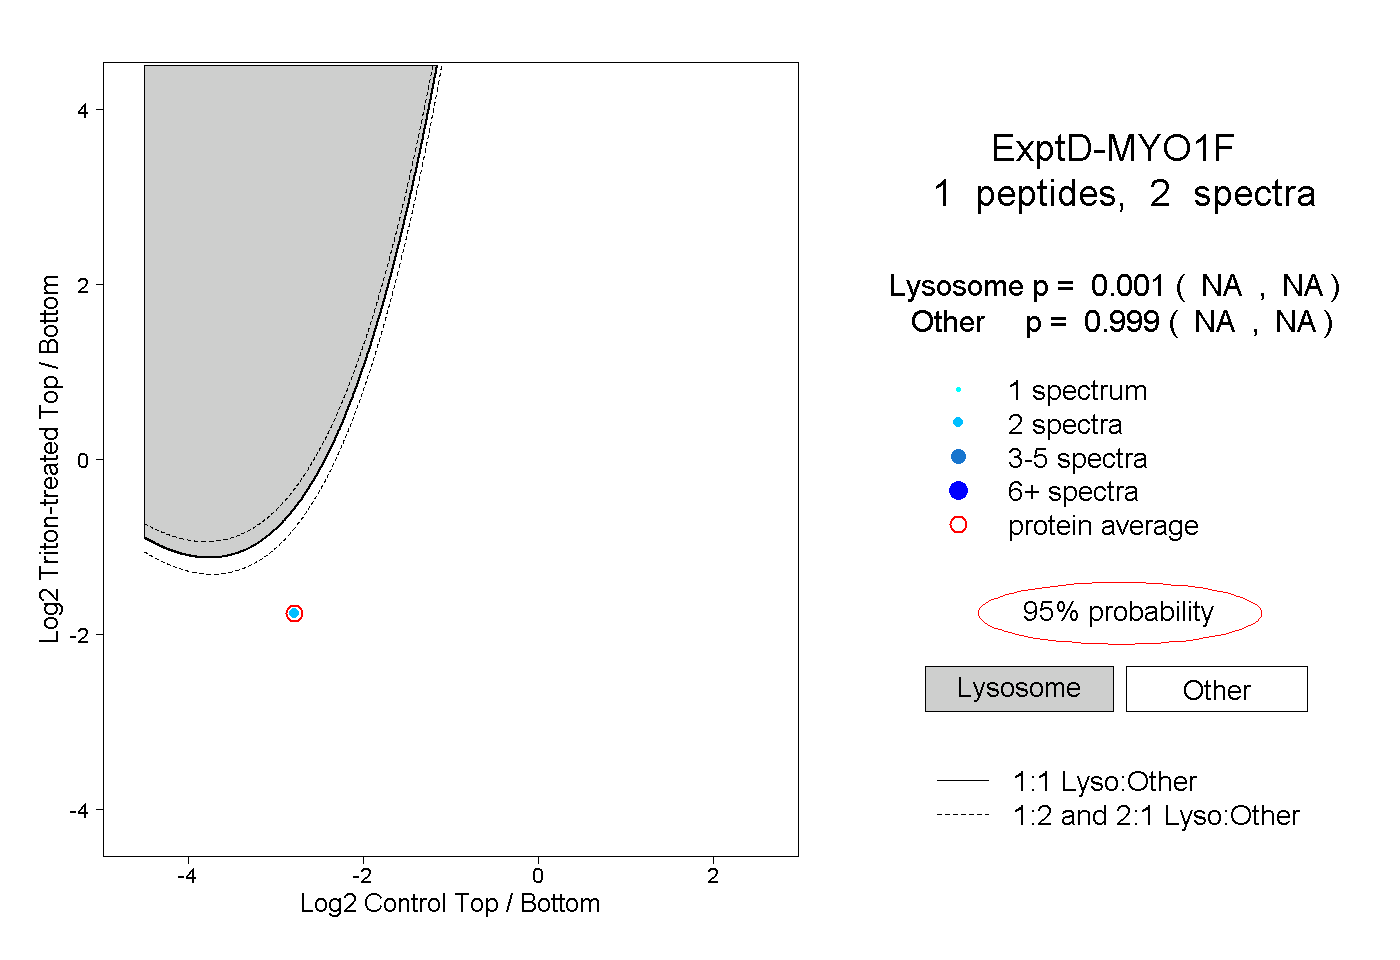 |
0.001 NA | NA |
0.999 NA | NA |