 7
7peptides
spectra
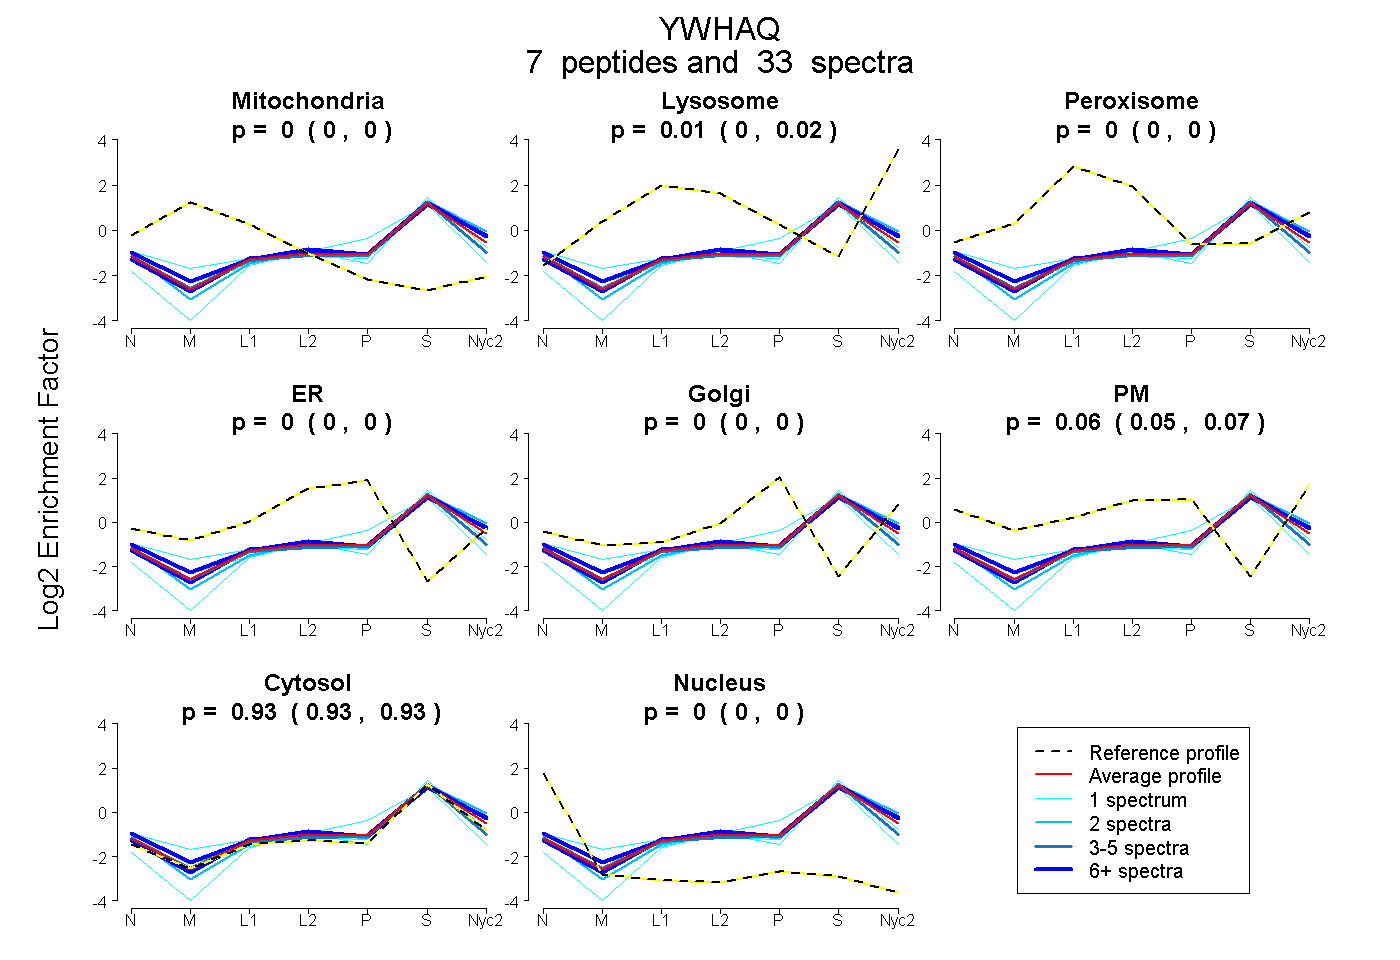
0.000 | 0.000
0.000 | 0.018
0.000 | 0.000
0.000 | 0.000
0.000 | 0.000
0.052 | 0.067
0.925 | 0.935
0.000 | 0.000
3peptides
spectra
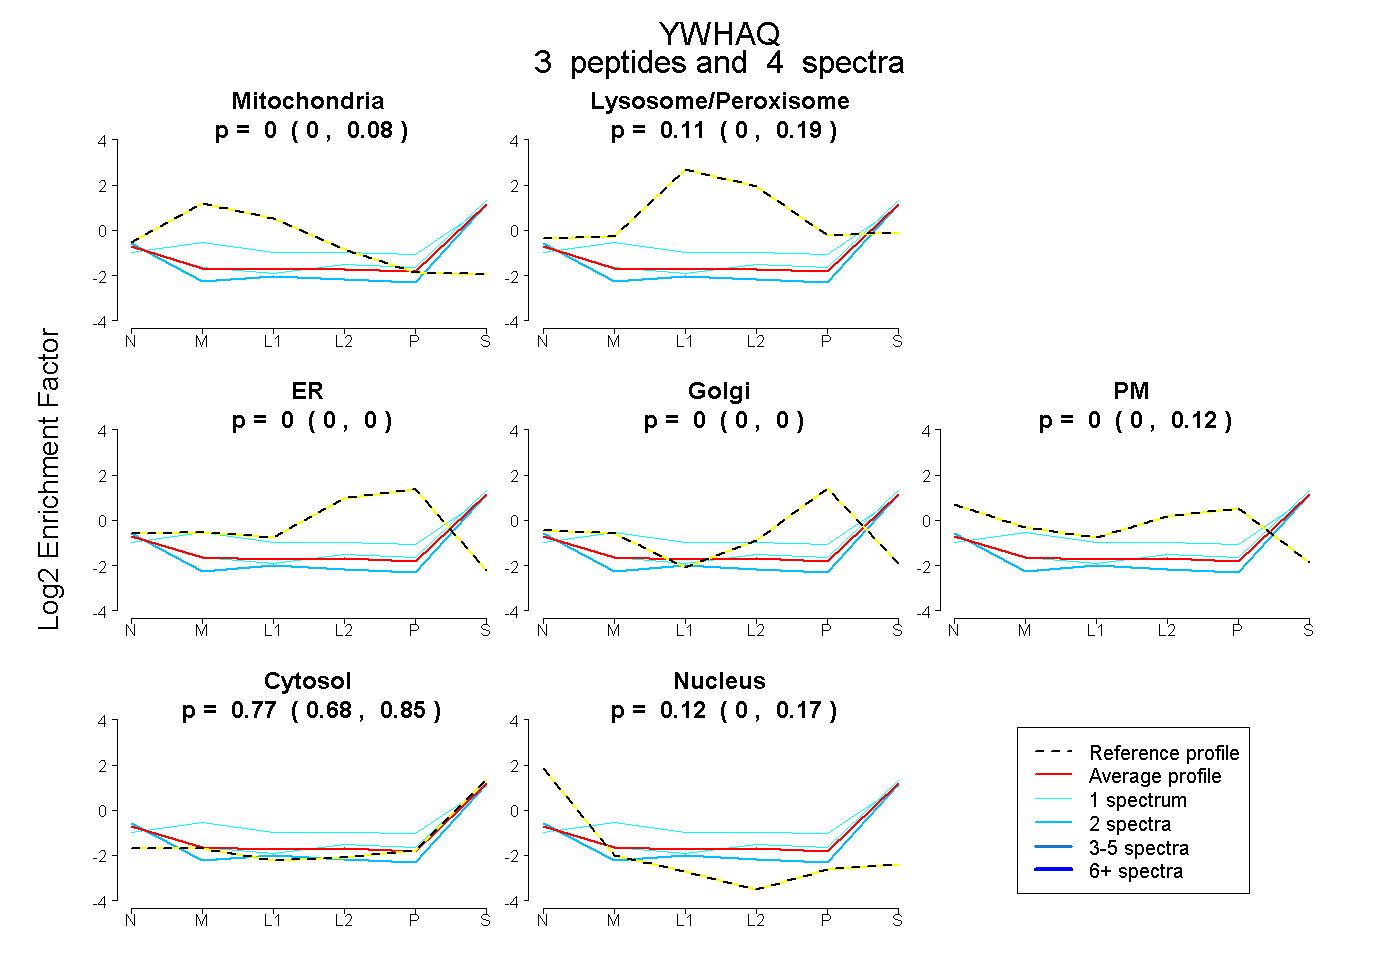
0.000 | 0.081
0.000 | 0.193
0.000 | 0.000
0.000 | 0.000
0.000 | 0.122
0.678 | 0.846
0.000 | 0.174
10peptides
spectra
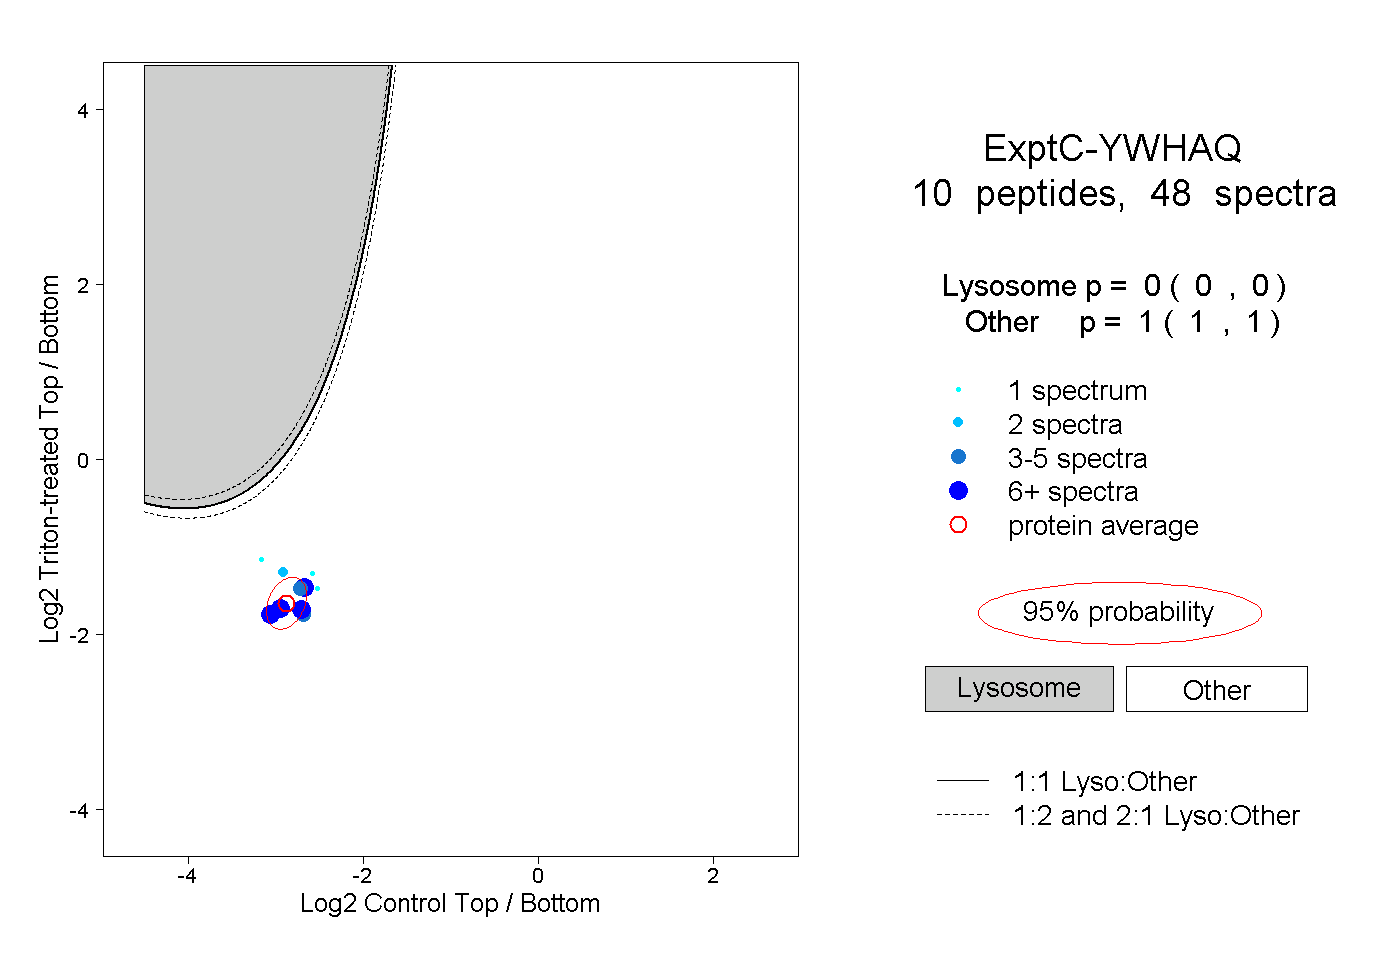
0.000 | 0.000
1.000 | 1.000
1peptide
spectra
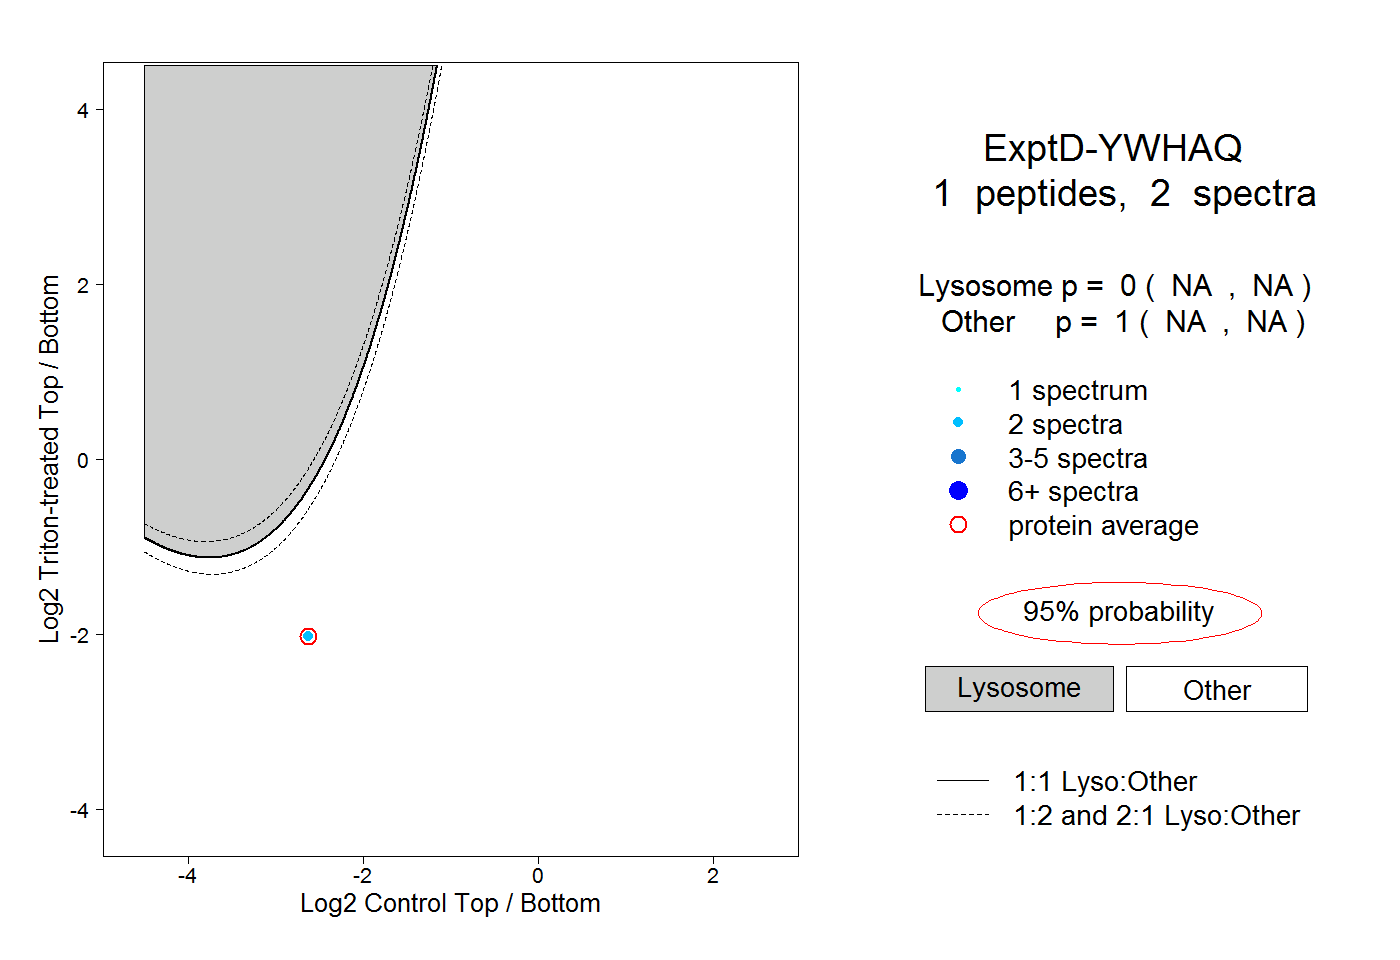
NA | NA
NA | NA