 7
7peptides
spectra
0.000 | 0.000
0.000 | 0.018
0.000 | 0.000
0.000 | 0.000
0.000 | 0.000
0.052 | 0.067
0.925 | 0.935
0.000 | 0.000
| Plot | Mito | Lyso | Perox | ER | Golgi | PM | Cytosol | Nucleus | |||||
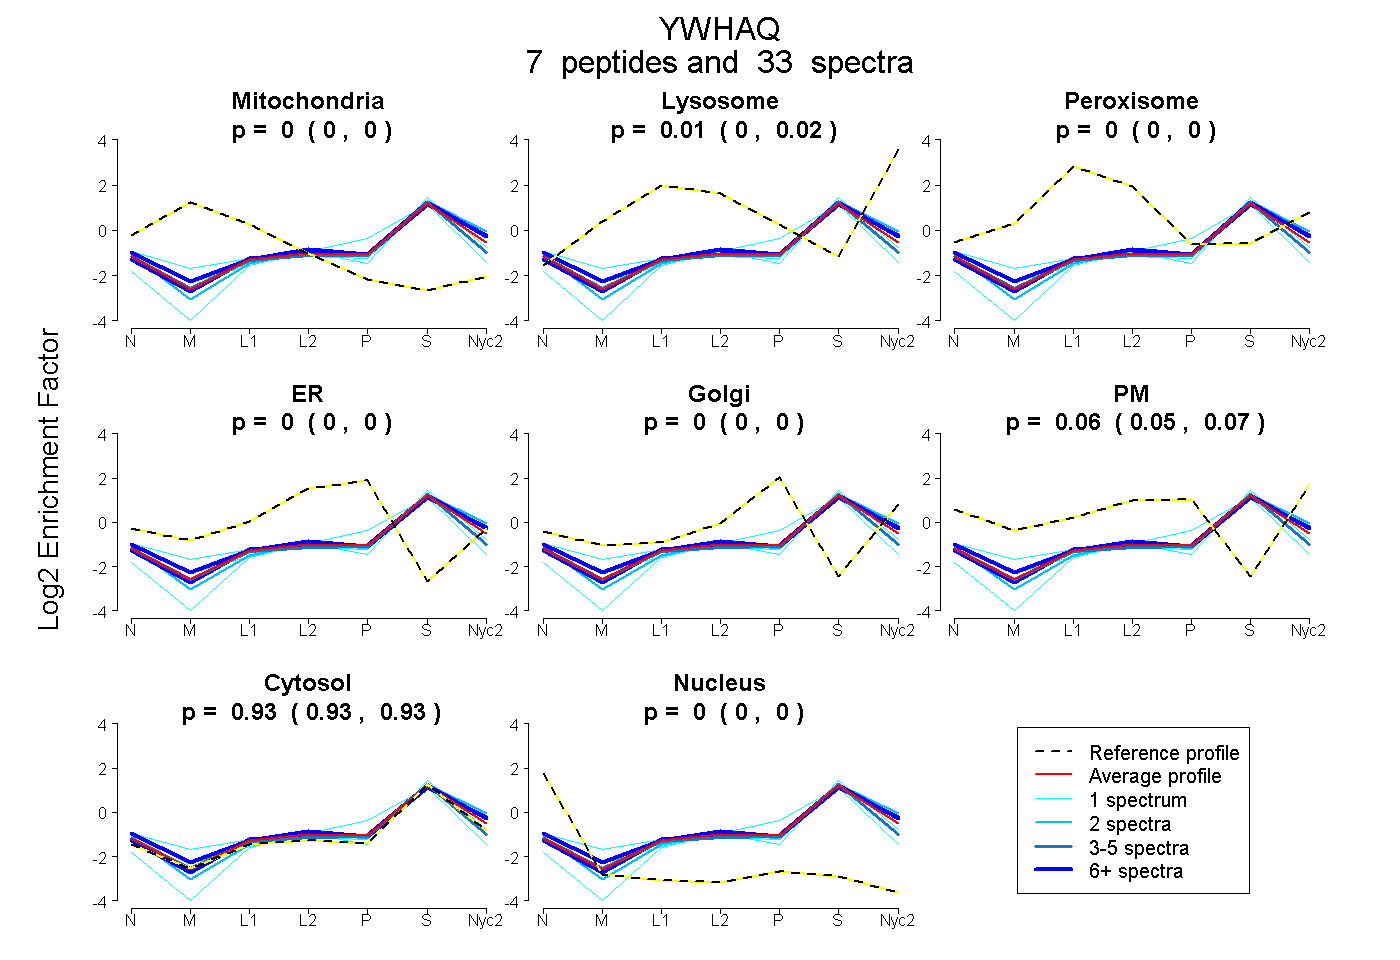
| Expt A |
7 peptides |
33 spectra |
|
0.000 0.000 | 0.000 |
0.009 0.000 | 0.018 |
0.000 0.000 | 0.000 |
0.000 0.000 | 0.000 |
0.000 0.000 | 0.000 |
0.060 0.052 | 0.067 |
0.930 0.925 | 0.935 |
0.000 0.000 | 0.000 |
| 1 spectrum, AVTEQGAELSNEER | 0.000 | 0.000 | 0.000 | 0.000 | 0.000 | 0.000 | 1.000 | 0.000 | ||
| 2 spectra, TDTSDK | 0.000 | 0.026 | 0.000 | 0.000 | 0.000 | 0.043 | 0.931 | 0.000 | ||
| 4 spectra, YLAEVACGDDR | 0.000 | 0.000 | 0.000 | 0.043 | 0.000 | 0.000 | 0.953 | 0.005 | ||
| 1 spectrum, SICTTVLELLDK | 0.000 | 0.000 | 0.000 | 0.125 | 0.000 | 0.000 | 0.852 | 0.023 | ||
| 1 spectrum, NVVGGR | 0.038 | 0.071 | 0.000 | 0.000 | 0.000 | 0.039 | 0.852 | 0.000 | ||
| 8 spectra, VLSSIEQK | 0.000 | 0.039 | 0.000 | 0.000 | 0.000 | 0.091 | 0.870 | 0.000 | ||
| 16 spectra, YDDMATCMK | 0.000 | 0.055 | 0.000 | 0.000 | 0.021 | 0.000 | 0.924 | 0.000 |
| Plot | Mito | Lyso or Perox | ER | Golgi | PM | Cytosol | Nucleus | ||||||
| Expt B |
3 peptides |
4 spectra |
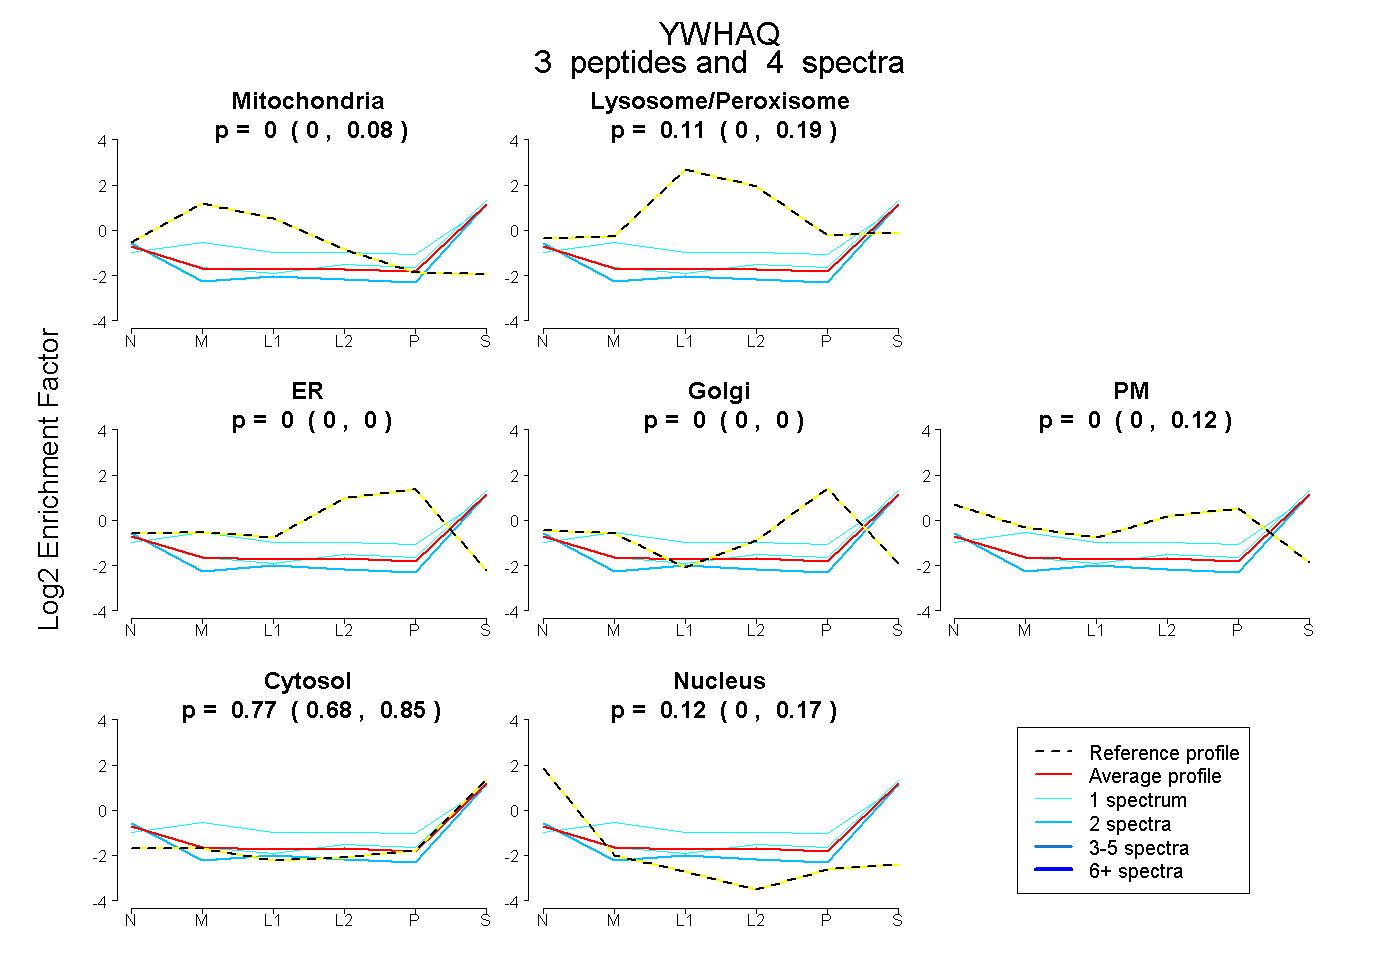 |
0.000 0.000 | 0.081 |
0.111 0.000 | 0.193 |
0.000 0.000 | 0.000 |
0.000 0.000 | 0.000 |
0.000 0.000 | 0.122 |
0.771 0.678 | 0.846 |
0.118 0.000 | 0.174 |
|||
| Plot | Lyso | Other | |||||||||||
| Expt C |
10 peptides |
48 spectra |
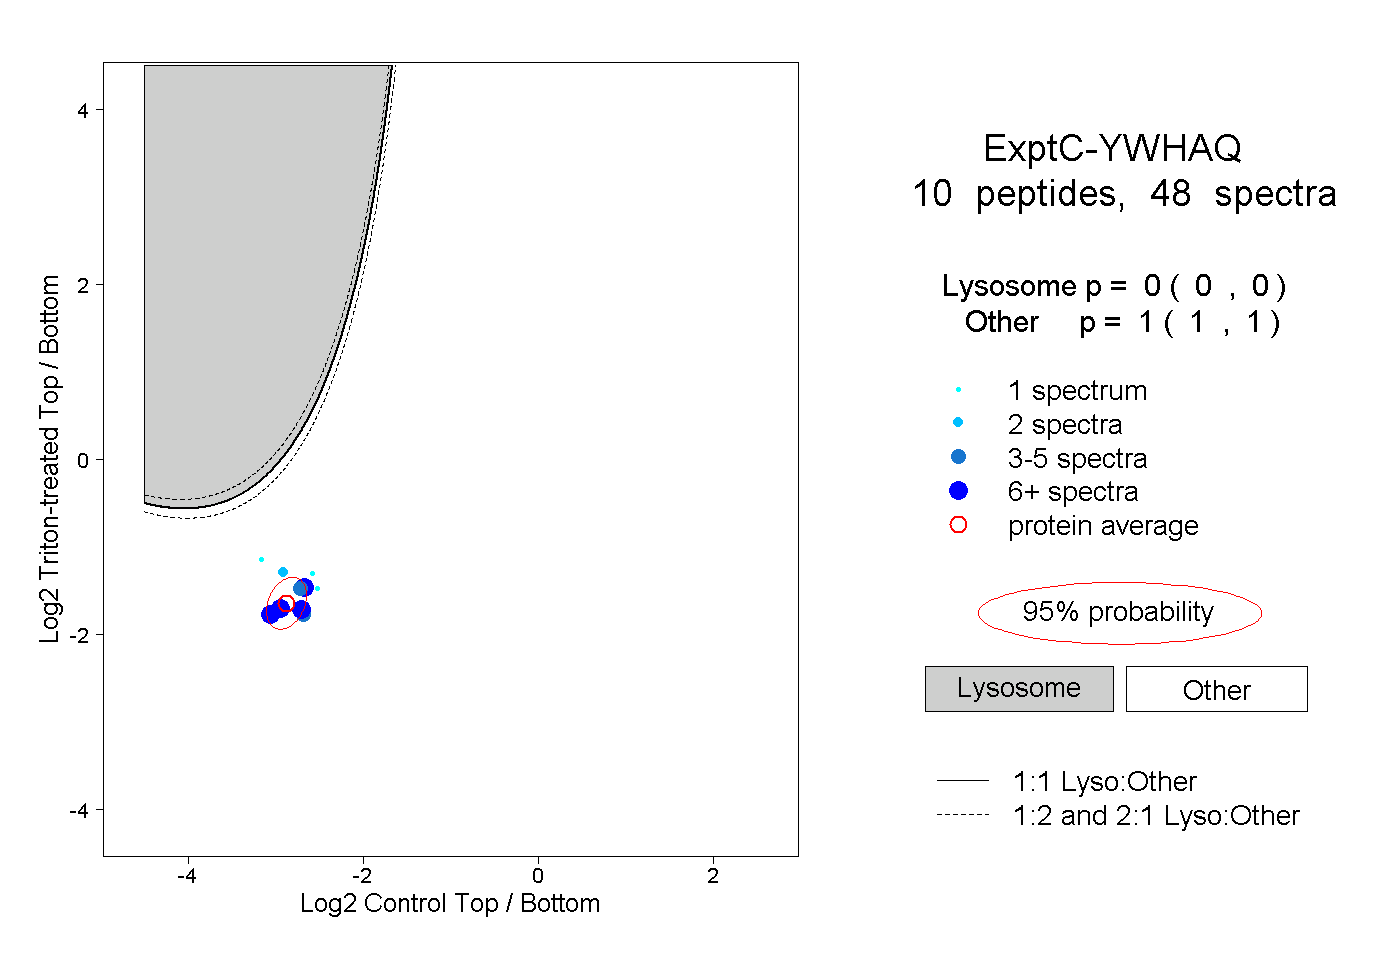 |
0.000 0.000 | 0.000 |
1.000 1.000 | 1.000 |
||||||||
| Plot | Lyso | Other | |||||||||||
| Expt D |
1 peptide |
2 spectra |
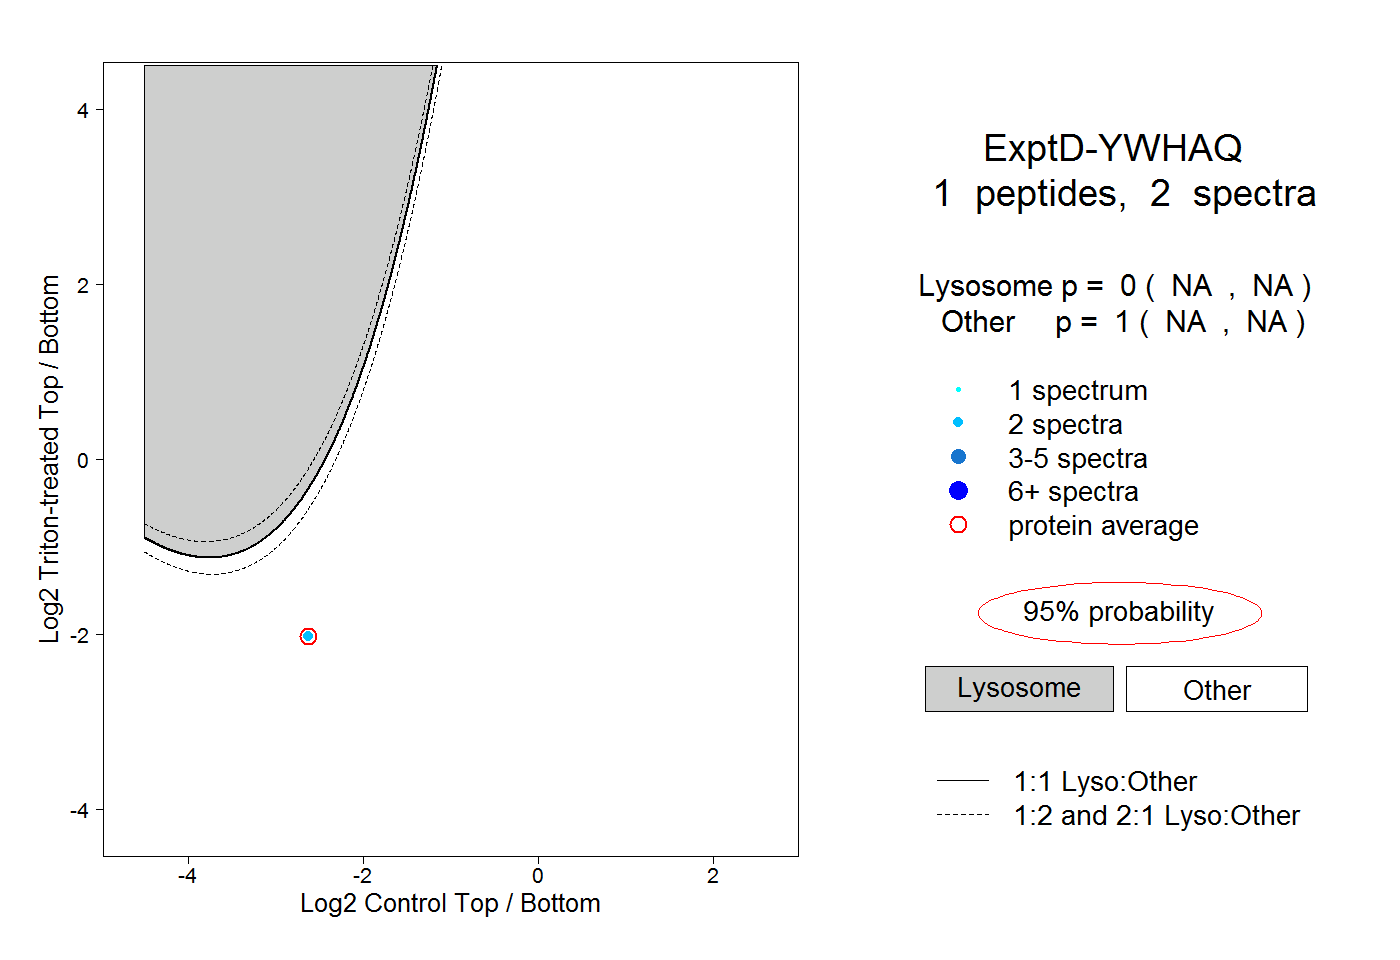 |
0.000 NA | NA |
1.000 NA | NA |