 21
21peptides
spectra
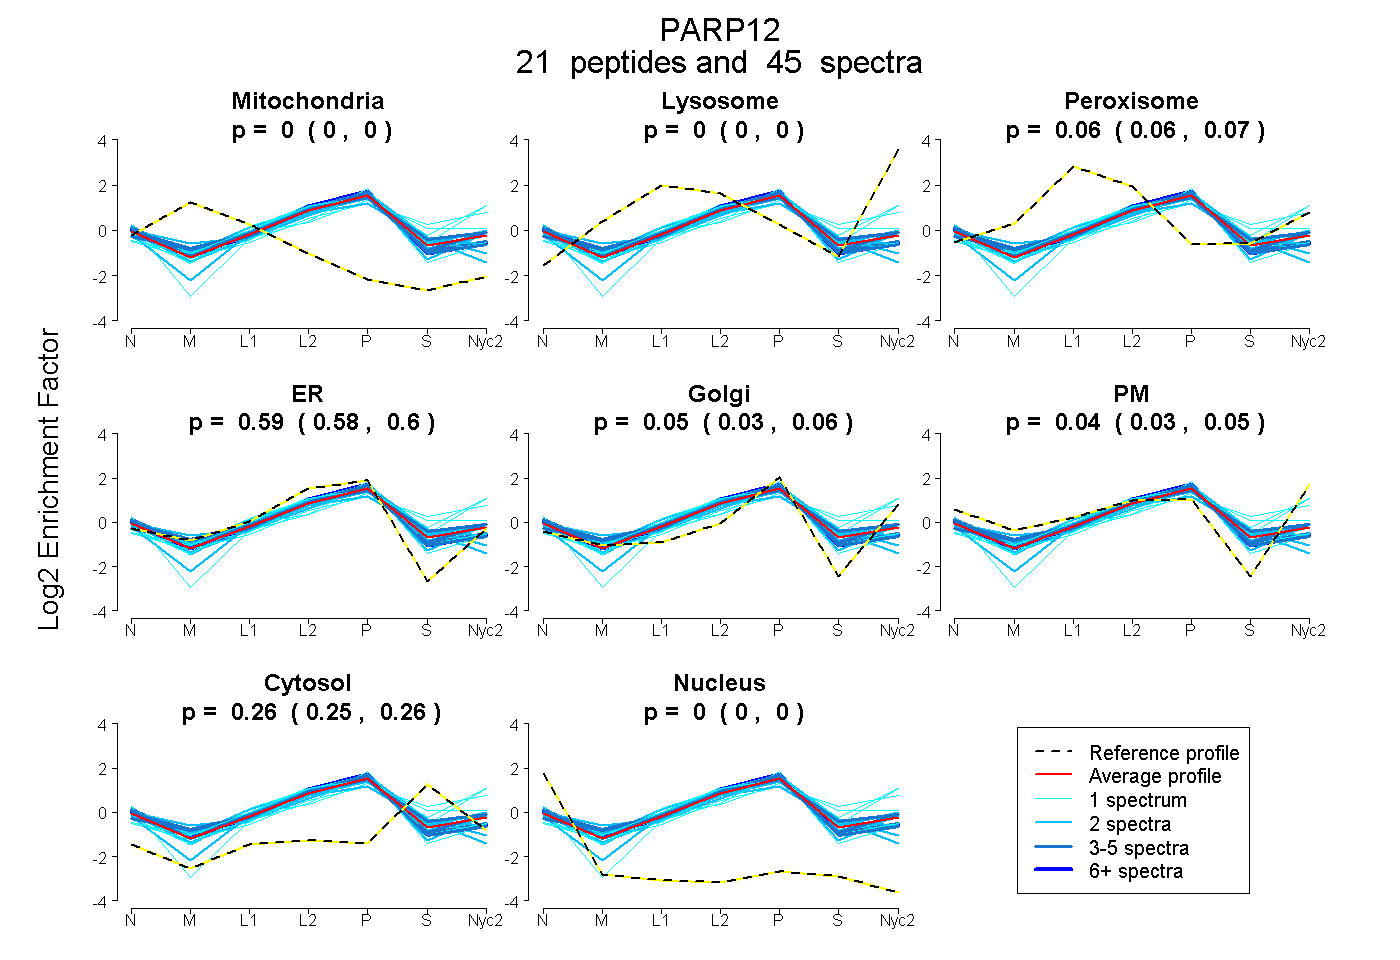
0.000 | 0.000
0.000 | 0.000
0.058 | 0.070
0.575 | 0.605
0.032 | 0.059
0.028 | 0.050
0.254 | 0.262
0.000 | 0.000
8peptides
spectra
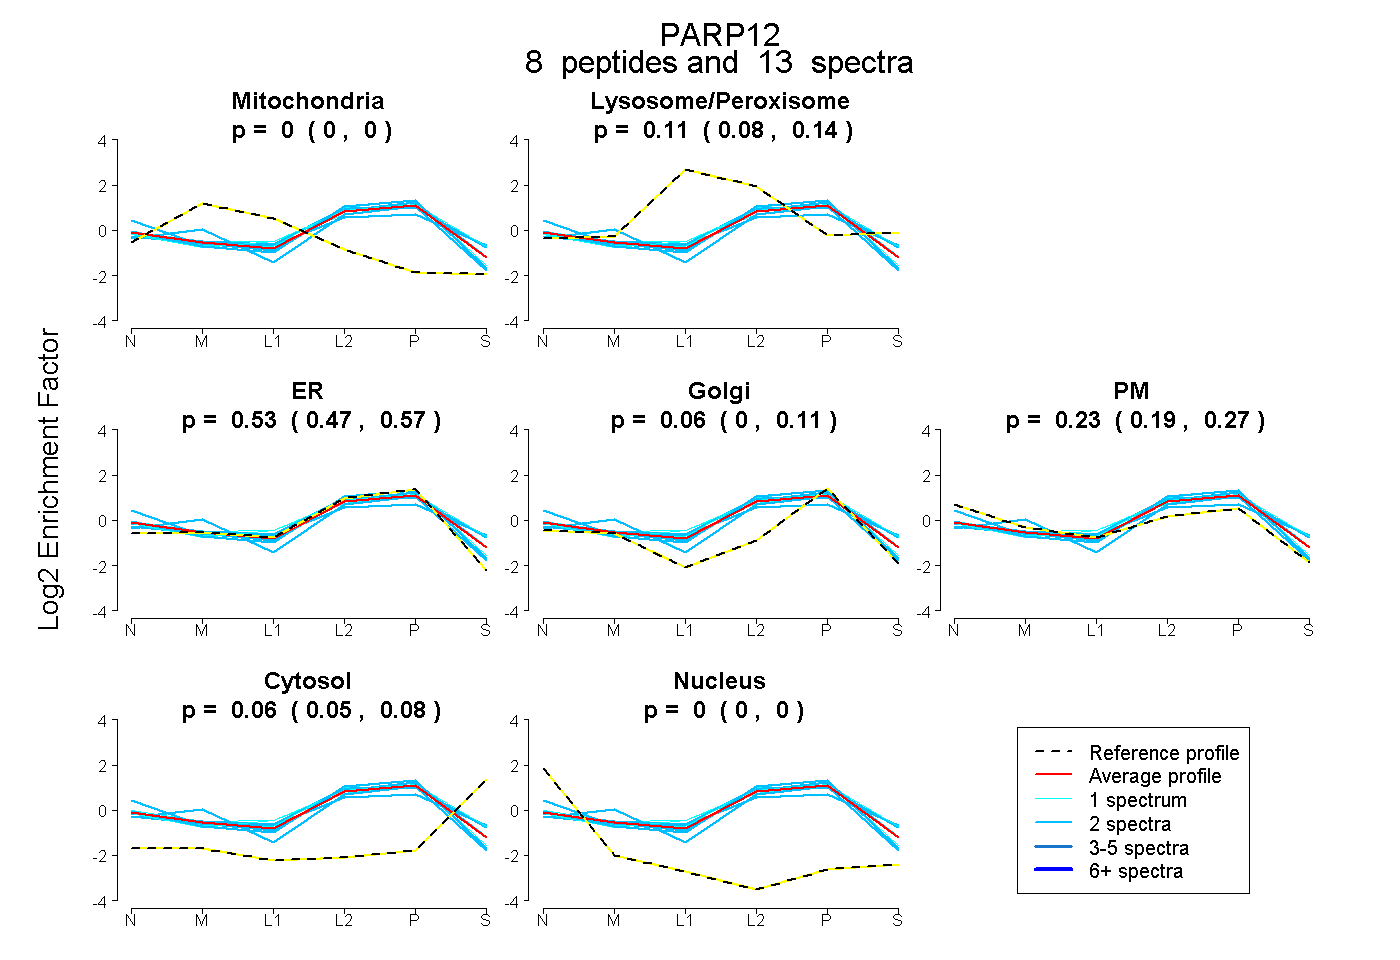
0.000 | 0.000
0.080 | 0.137
0.472 | 0.573
0.004 | 0.115
0.195 | 0.266
0.047 | 0.077
0.000 | 0.000
20peptides
spectra
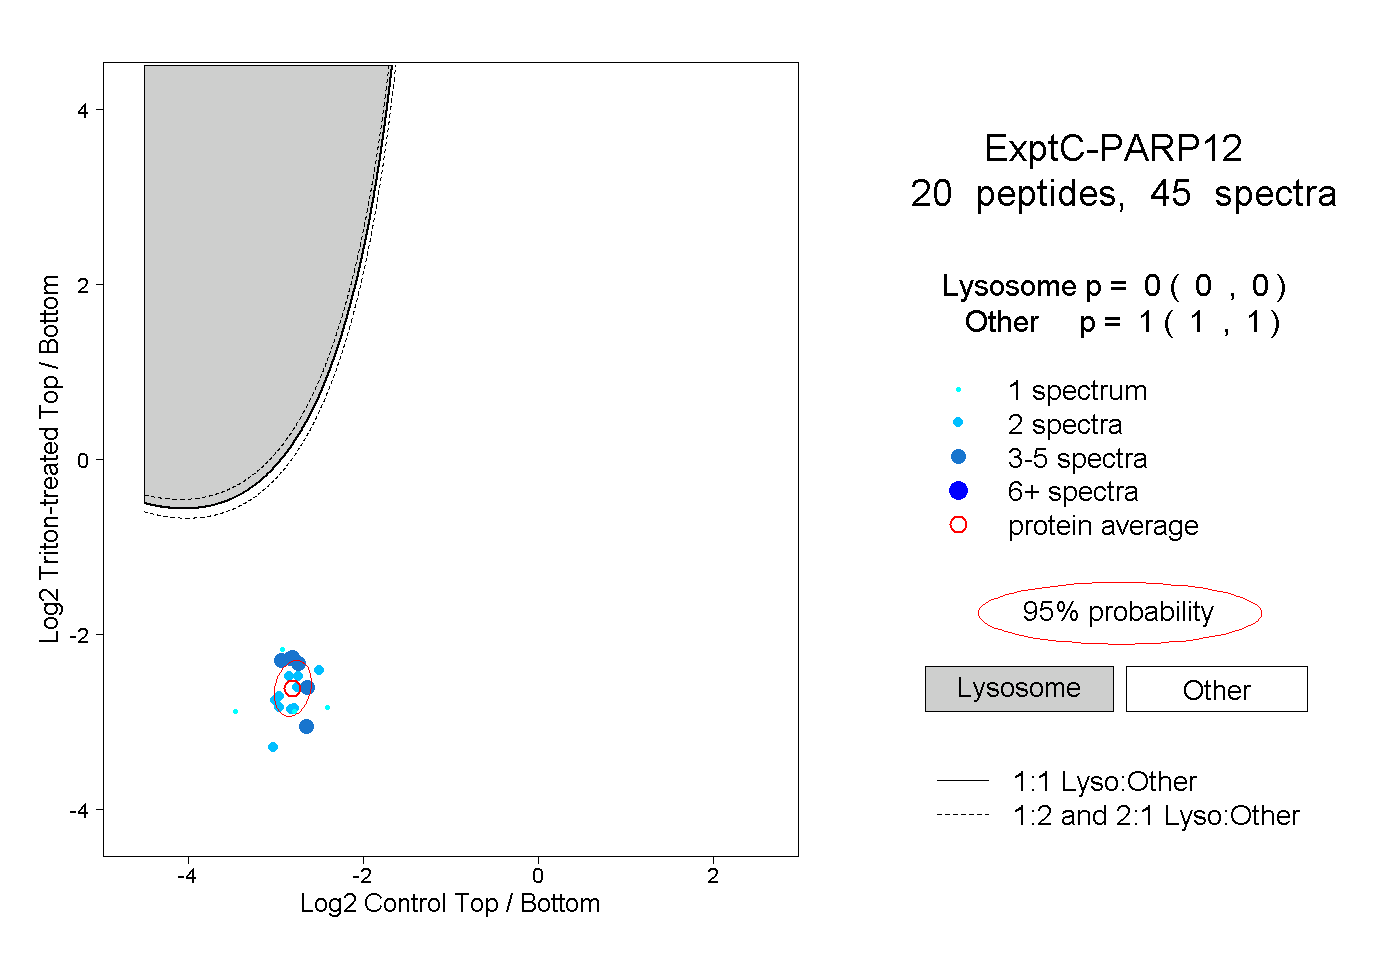
0.000 | 0.000
1.000 | 1.000
9peptides
spectra
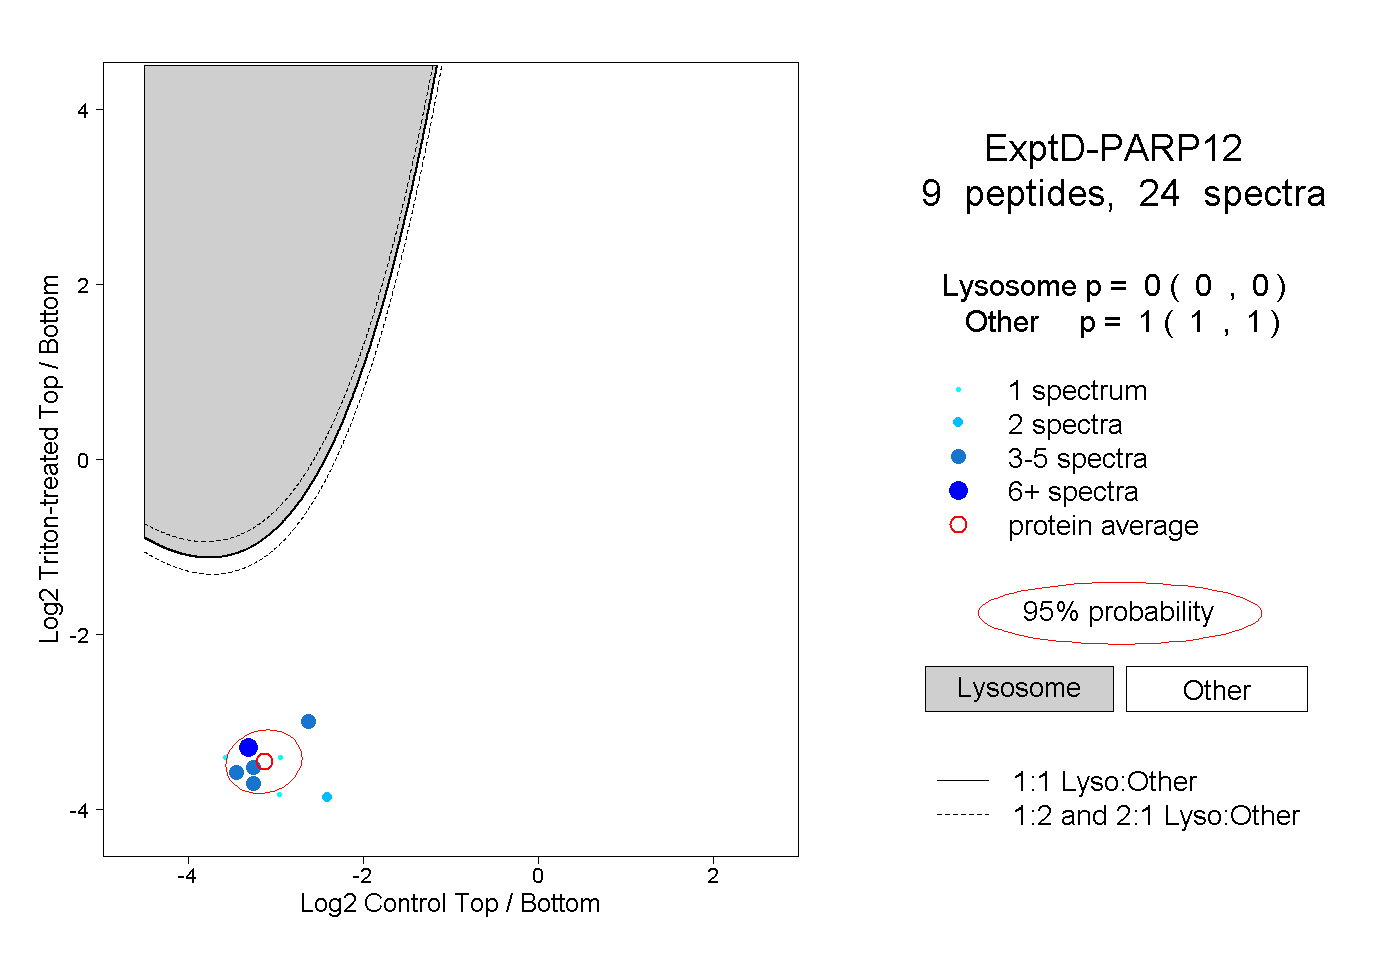
0.000 | 0.000
1.000 | 1.000