 21
21peptides
spectra
0.000 | 0.000
0.000 | 0.000
0.058 | 0.070
0.575 | 0.605
0.032 | 0.059
0.028 | 0.050
0.254 | 0.262
0.000 | 0.000
| Plot | Mito | Lyso | Perox | ER | Golgi | PM | Cytosol | Nucleus | |||||
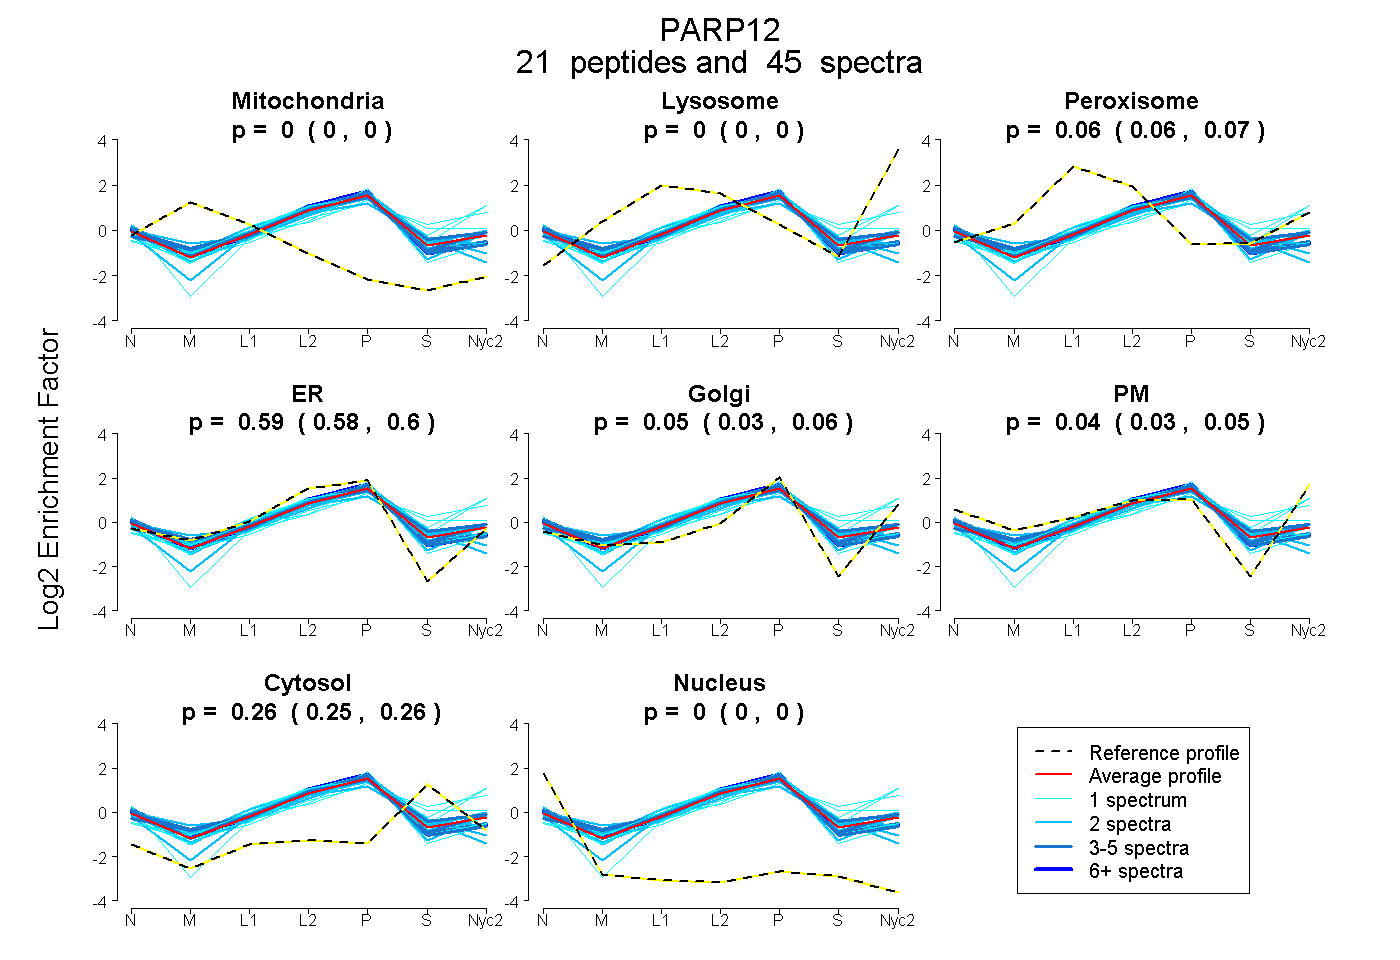
| Expt A |
21 peptides |
45 spectra |
|
0.000 0.000 | 0.000 |
0.000 0.000 | 0.000 |
0.064 0.058 | 0.070 |
0.591 0.575 | 0.605 |
0.047 0.032 | 0.059 |
0.039 0.028 | 0.050 |
0.258 0.254 | 0.262 |
0.000 0.000 | 0.000 |
| 2 spectra, NLVYGTVR | 0.000 | 0.000 | 0.071 | 0.590 | 0.023 | 0.112 | 0.205 | 0.000 | ||
| 4 spectra, LGHTLAR | 0.000 | 0.000 | 0.061 | 0.714 | 0.000 | 0.002 | 0.223 | 0.000 | ||
| 1 spectrum, YVSPQDVQMK | 0.000 | 0.295 | 0.000 | 0.321 | 0.149 | 0.000 | 0.234 | 0.000 | ||
| 1 spectrum, SIPDYWDPAALPDLGFK | 0.000 | 0.223 | 0.000 | 0.321 | 0.185 | 0.079 | 0.192 | 0.000 | ||
| 2 spectra, FLIYGNCK | 0.000 | 0.000 | 0.000 | 0.643 | 0.000 | 0.000 | 0.357 | 0.000 | ||
| 2 spectra, VHFHLPYR | 0.000 | 0.000 | 0.000 | 0.648 | 0.000 | 0.000 | 0.352 | 0.000 | ||
| 2 spectra, TDHNLSVLR | 0.000 | 0.000 | 0.103 | 0.591 | 0.000 | 0.000 | 0.306 | 0.000 | ||
| 6 spectra, FVVASR | 0.000 | 0.000 | 0.001 | 0.771 | 0.000 | 0.000 | 0.228 | 0.000 | ||
| 2 spectra, EGTGPATAAAAASER | 0.000 | 0.000 | 0.129 | 0.607 | 0.047 | 0.012 | 0.206 | 0.000 | ||
| 2 spectra, LLSTYR | 0.000 | 0.000 | 0.090 | 0.454 | 0.126 | 0.067 | 0.263 | 0.000 | ||
| 2 spectra, SHEFTNSENLEK | 0.000 | 0.000 | 0.067 | 0.526 | 0.000 | 0.144 | 0.264 | 0.000 | ||
| 4 spectra, VVVAVSSLR | 0.000 | 0.000 | 0.013 | 0.755 | 0.000 | 0.000 | 0.231 | 0.000 | ||
| 1 spectrum, FGTSCK | 0.000 | 0.000 | 0.091 | 0.641 | 0.000 | 0.078 | 0.190 | 0.000 | ||
| 1 spectrum, TLPFYFVQK | 0.000 | 0.000 | 0.000 | 0.767 | 0.039 | 0.000 | 0.182 | 0.012 | ||
| 1 spectrum, GSYFAR | 0.000 | 0.000 | 0.176 | 0.205 | 0.281 | 0.000 | 0.337 | 0.000 | ||
| 1 spectrum, VSSSPAGPQGTSER | 0.000 | 0.000 | 0.000 | 0.514 | 0.173 | 0.000 | 0.289 | 0.024 | ||
| 3 spectra, WQFLDGGEWK | 0.000 | 0.000 | 0.138 | 0.475 | 0.135 | 0.000 | 0.252 | 0.000 | ||
| 2 spectra, GSTSFVRPPAK | 0.000 | 0.000 | 0.061 | 0.590 | 0.126 | 0.069 | 0.154 | 0.000 | ||
| 3 spectra, VLVGDFVR | 0.000 | 0.000 | 0.099 | 0.535 | 0.089 | 0.071 | 0.206 | 0.000 | ||
| 1 spectrum, LGLSSDLVSR | 0.000 | 0.207 | 0.000 | 0.163 | 0.232 | 0.023 | 0.375 | 0.000 | ||
| 2 spectra, AHQGPK | 0.000 | 0.000 | 0.057 | 0.516 | 0.000 | 0.152 | 0.276 | 0.000 |
| Plot | Mito | Lyso or Perox | ER | Golgi | PM | Cytosol | Nucleus | ||||||
| Expt B |
8 peptides |
13 spectra |
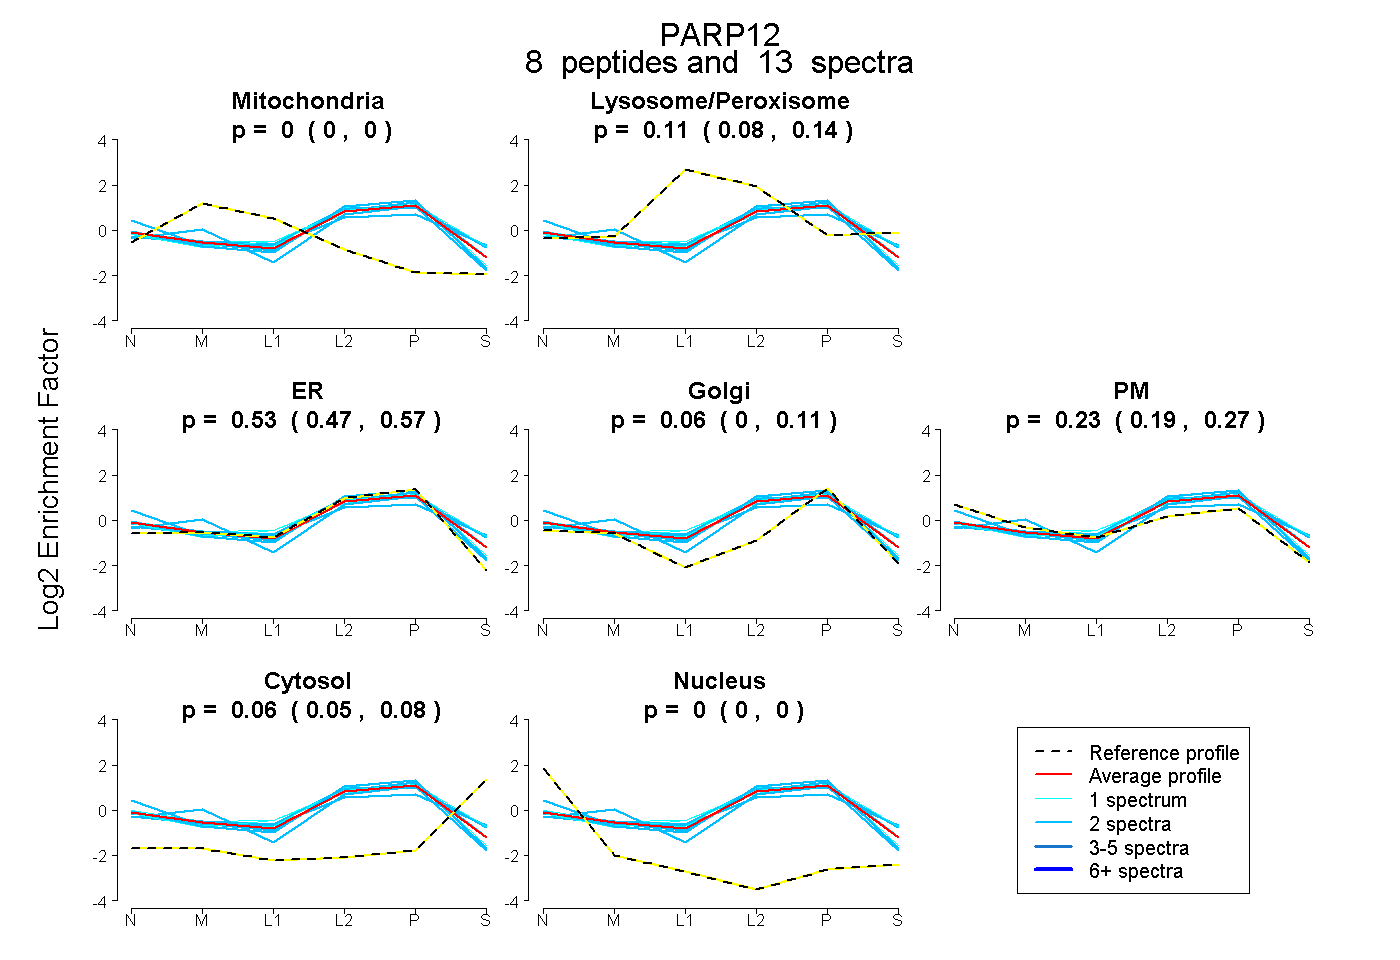 |
0.000 0.000 | 0.000 |
0.110 0.080 | 0.137 |
0.530 0.472 | 0.573 |
0.064 0.004 | 0.115 |
0.233 0.195 | 0.266 |
0.063 0.047 | 0.077 |
0.000 0.000 | 0.000 |
|||
| Plot | Lyso | Other | |||||||||||
| Expt C |
20 peptides |
45 spectra |
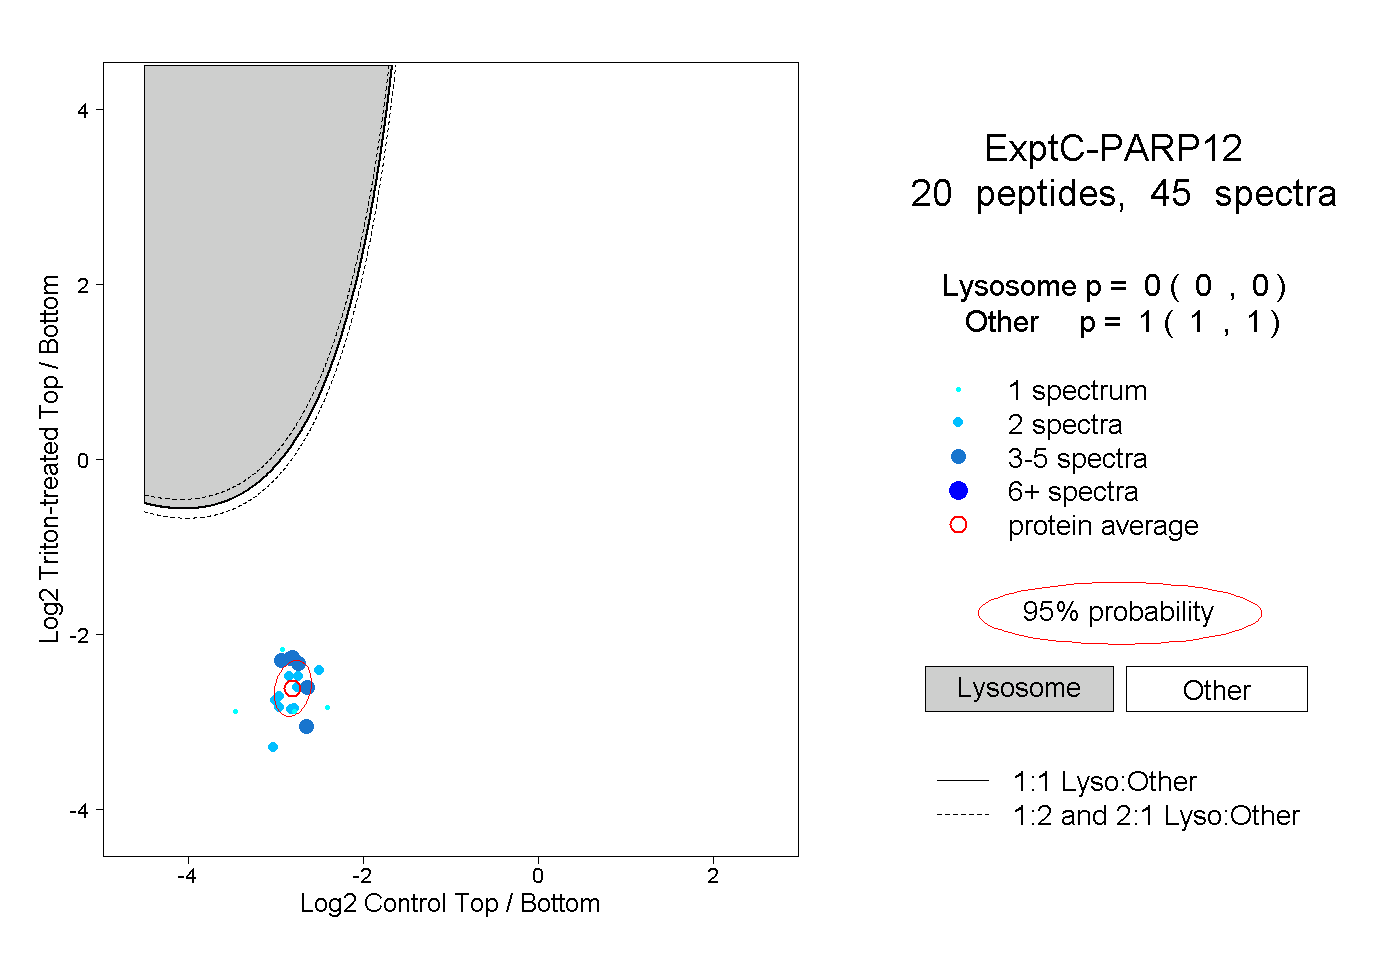 |
0.000 0.000 | 0.000 |
1.000 1.000 | 1.000 |
||||||||
| Plot | Lyso | Other | |||||||||||
| Expt D |
9 peptides |
24 spectra |
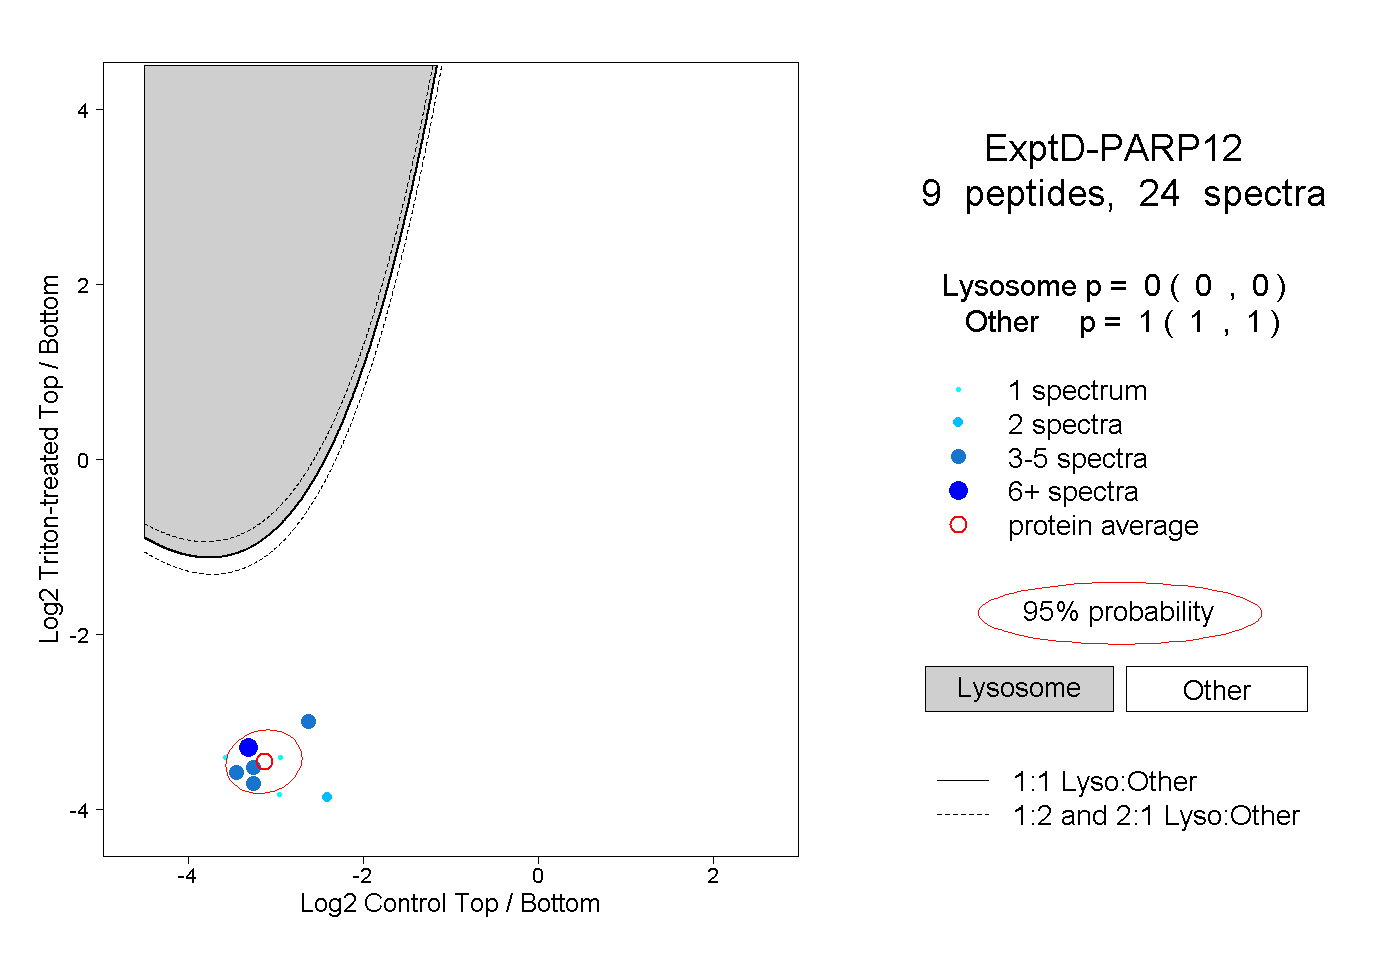 |
0.000 0.000 | 0.000 |
1.000 1.000 | 1.000 |