 3
3peptides
spectra
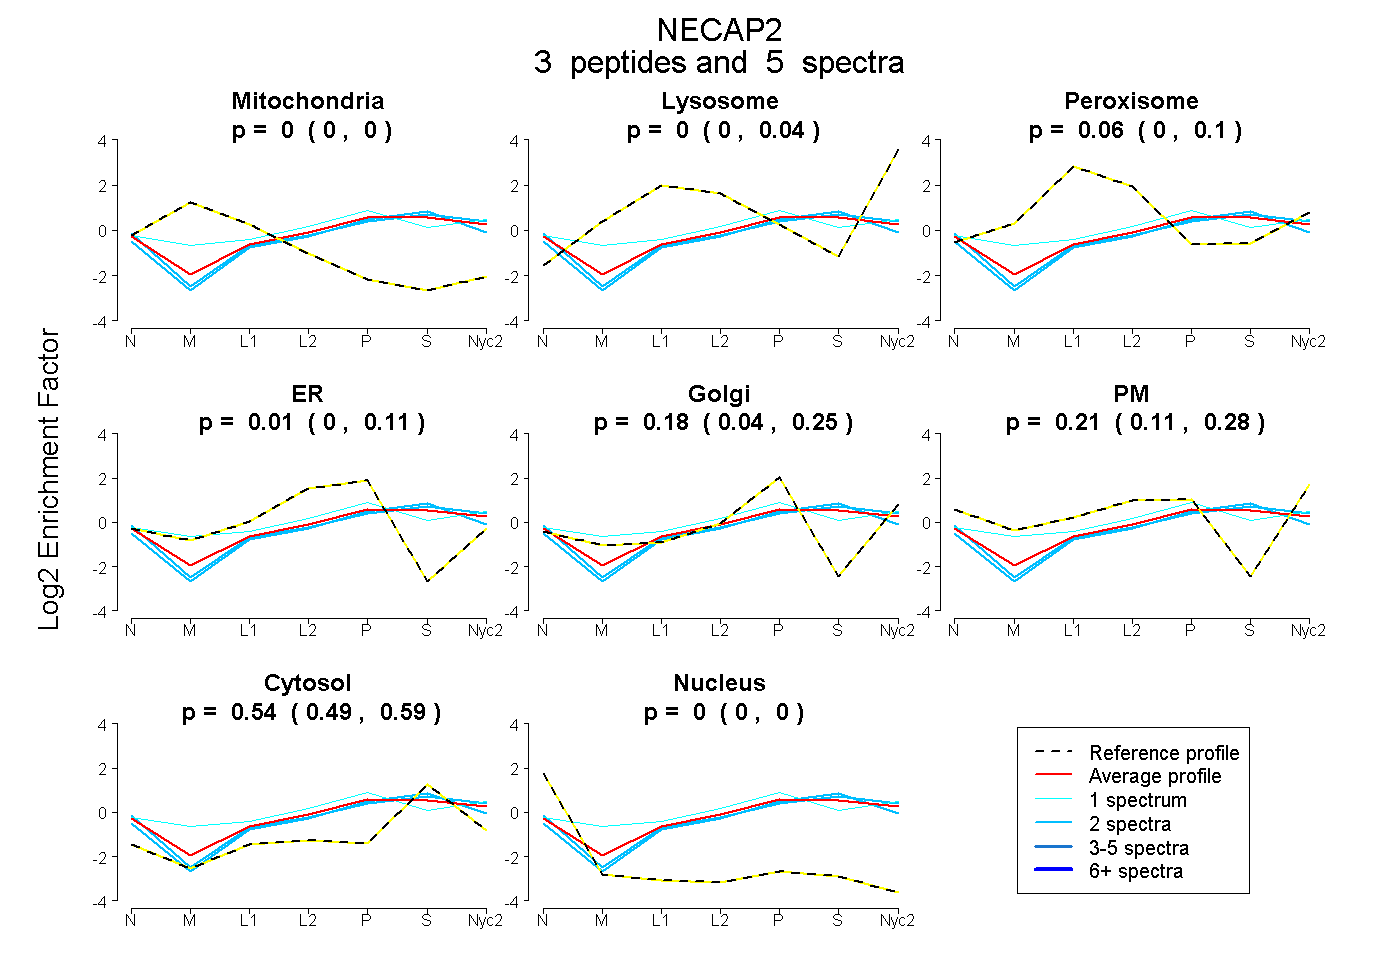
0.000 | 0.000
0.000 | 0.042
0.000 | 0.105
0.000 | 0.106
0.043 | 0.255
0.110 | 0.283
0.493 | 0.592
0.000 | 0.000
2peptides
spectra
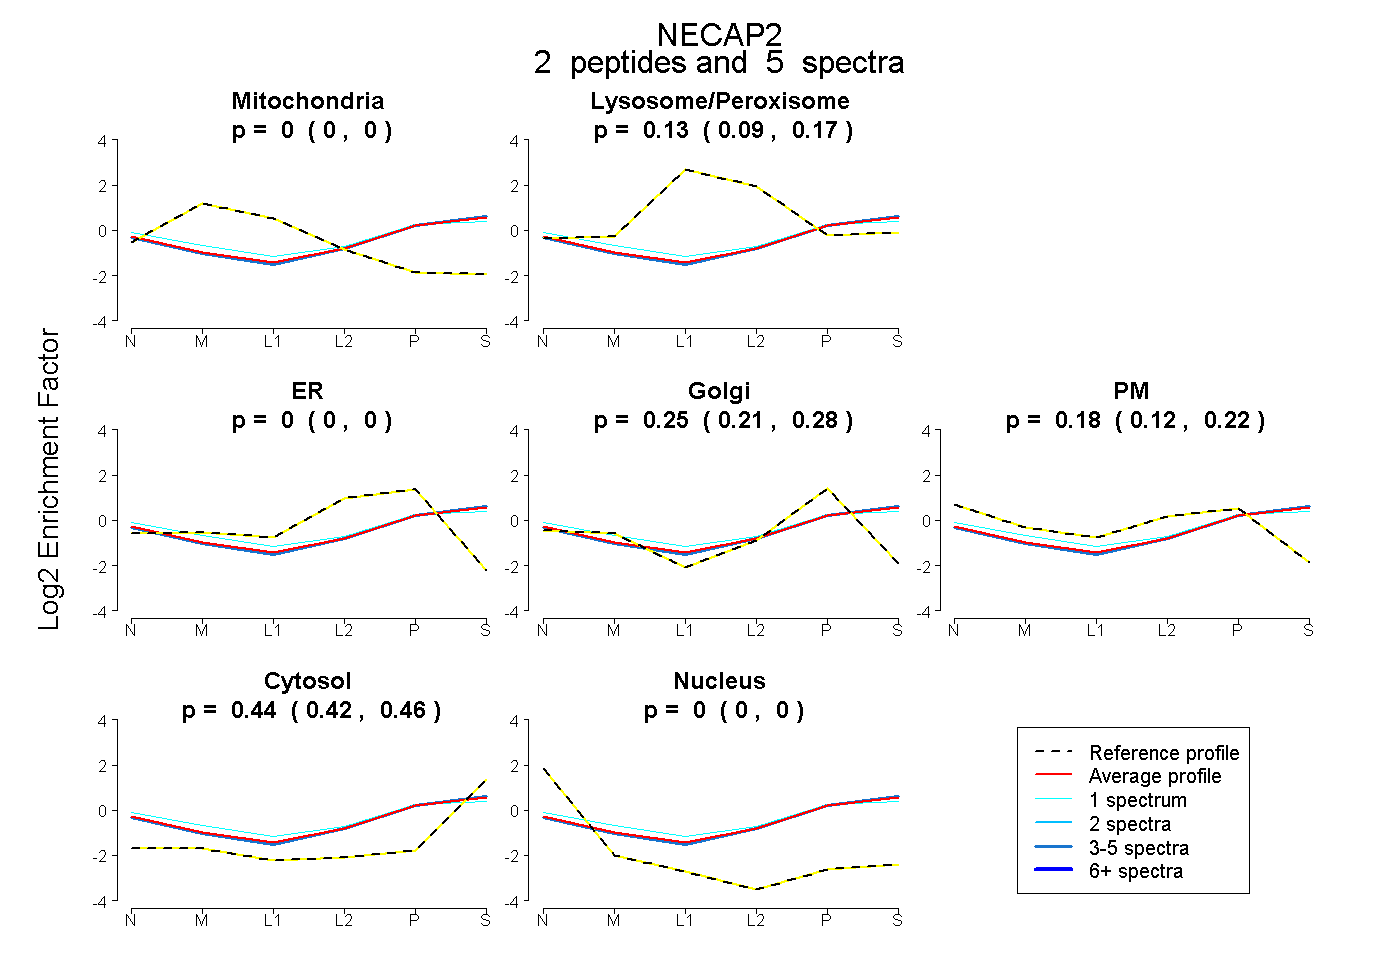
0.000 | 0.000
0.085 | 0.169
0.000 | 0.000
0.214 | 0.276
0.124 | 0.225
0.420 | 0.460
0.000 | 0.000
4peptides
spectra
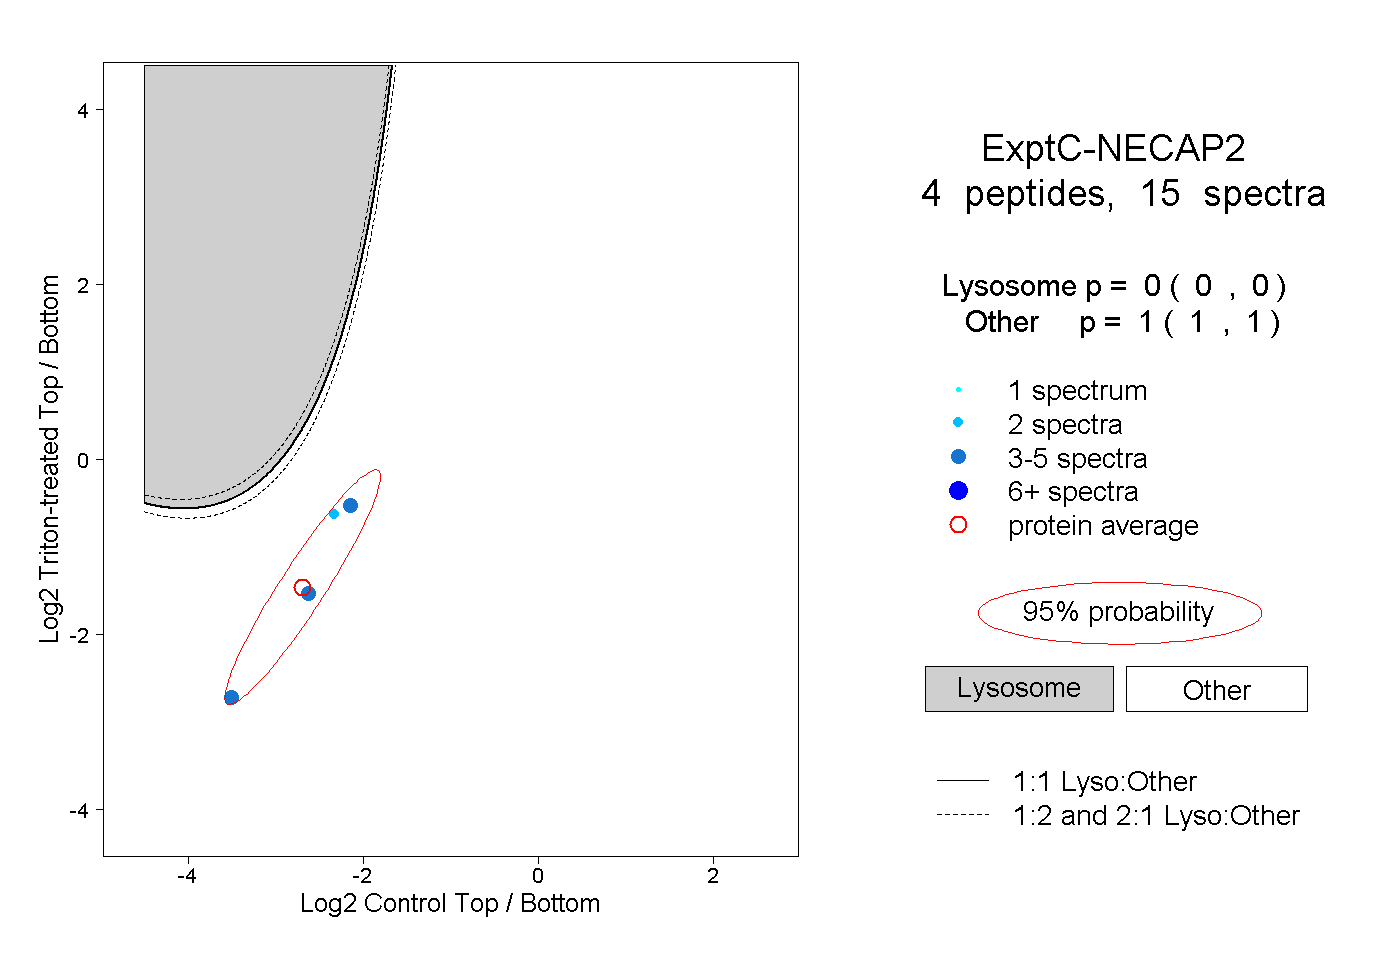
0.000 | 0.000
1.000 | 1.000