 3
3peptides
spectra
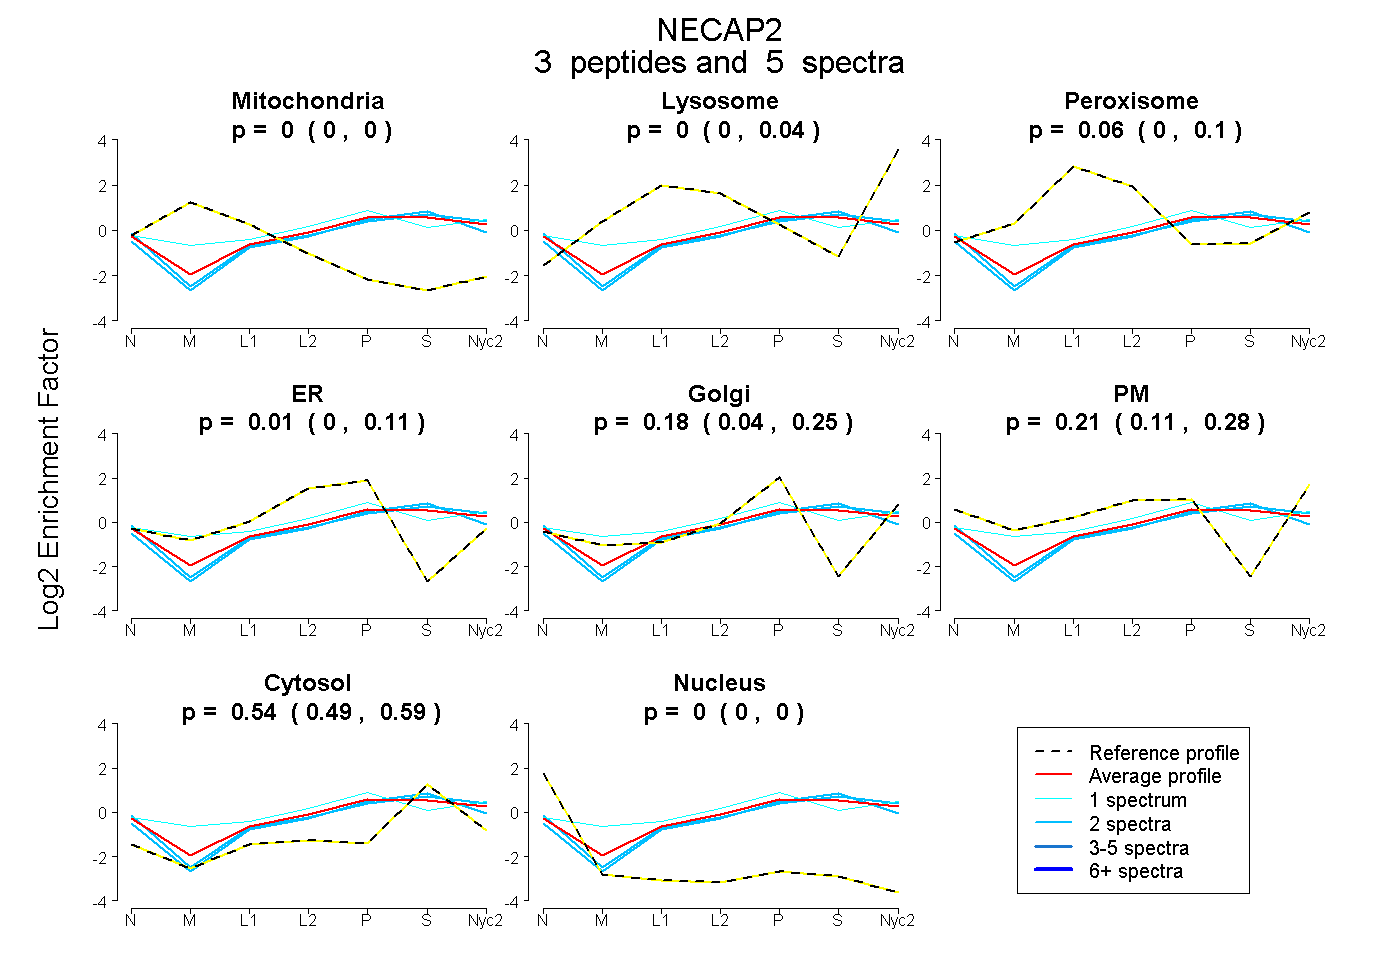
0.000 | 0.000
0.000 | 0.042
0.000 | 0.105
0.000 | 0.106
0.043 | 0.255
0.110 | 0.283
0.493 | 0.592
0.000 | 0.000
| Plot | Mito | Lyso | Perox | ER | Golgi | PM | Cytosol | Nucleus | |||||
| Expt A |
3 peptides |
5 spectra |
|
0.000 0.000 | 0.000 |
0.000 0.000 | 0.042 |
0.059 0.000 | 0.105 |
0.011 0.000 | 0.106 |
0.183 0.043 | 0.255 |
0.206 0.110 | 0.283 |
0.541 0.493 | 0.592 |
0.000 0.000 | 0.000 |
| 2 spectra, EGAAGAPR | 0.000 | 0.000 | 0.000 | 0.000 | 0.051 | 0.327 | 0.623 | 0.000 | ||
| 1 spectrum, QQCEFAK | 0.000 | 0.015 | 0.194 | 0.000 | 0.340 | 0.122 | 0.329 | 0.000 | ||
| 2 spectra, INIANMR | 0.000 | 0.006 | 0.000 | 0.136 | 0.119 | 0.079 | 0.661 | 0.000 |
| Plot | Mito | Lyso or Perox | ER | Golgi | PM | Cytosol | Nucleus | ||||||
| Expt B |
2 peptides |
5 spectra |
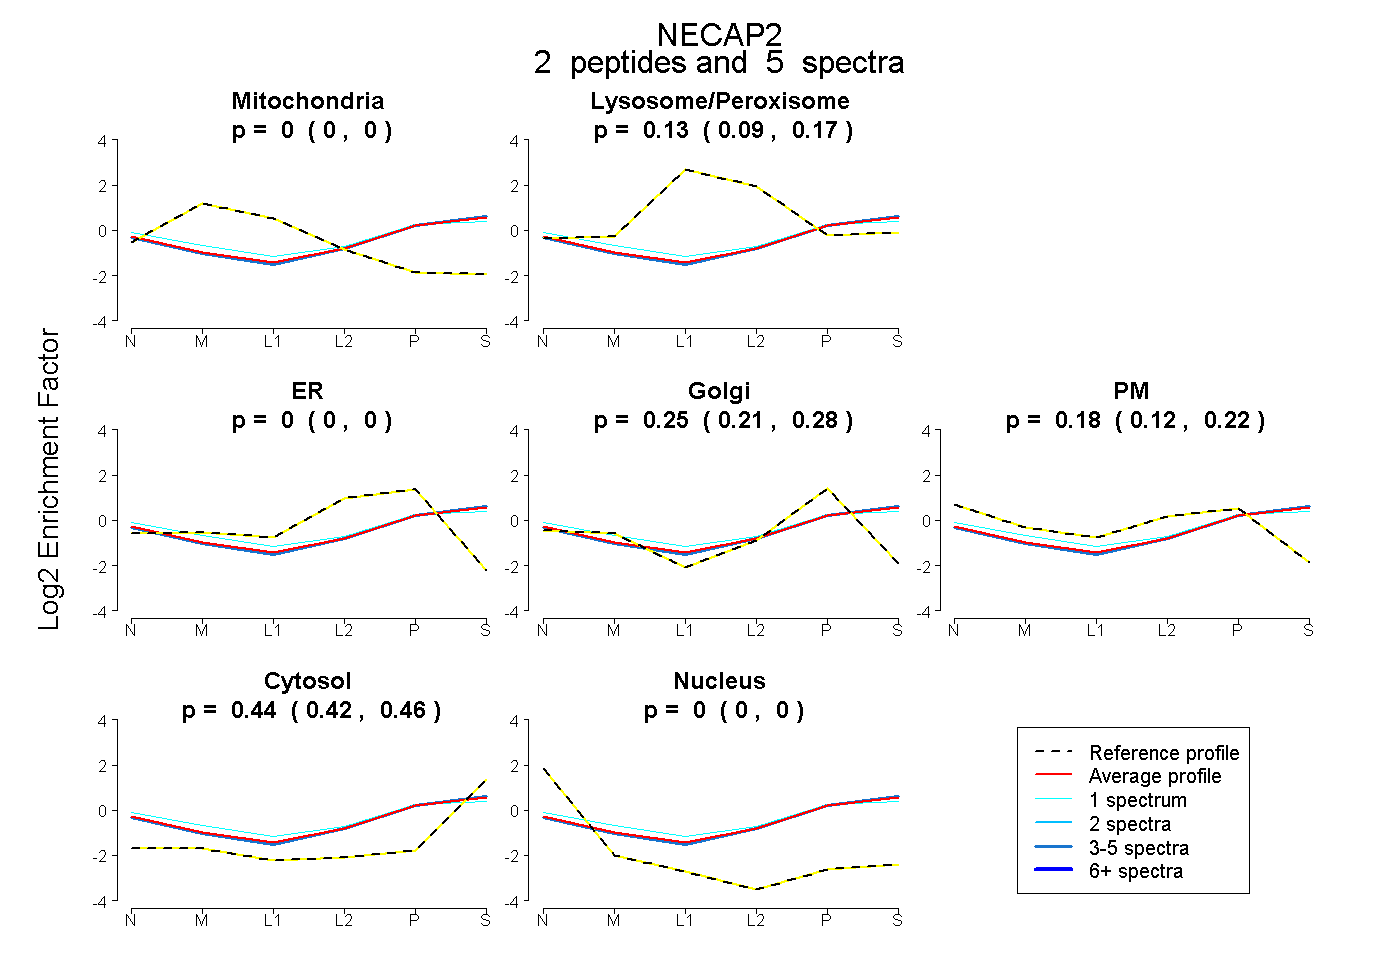 |
0.000 0.000 | 0.000 |
0.132 0.085 | 0.169 |
0.000 0.000 | 0.000 |
0.247 0.214 | 0.276 |
0.179 0.124 | 0.225 |
0.442 0.420 | 0.460 |
0.000 0.000 | 0.000 |
|||
| Plot | Lyso | Other | |||||||||||
| Expt C |
4 peptides |
15 spectra |
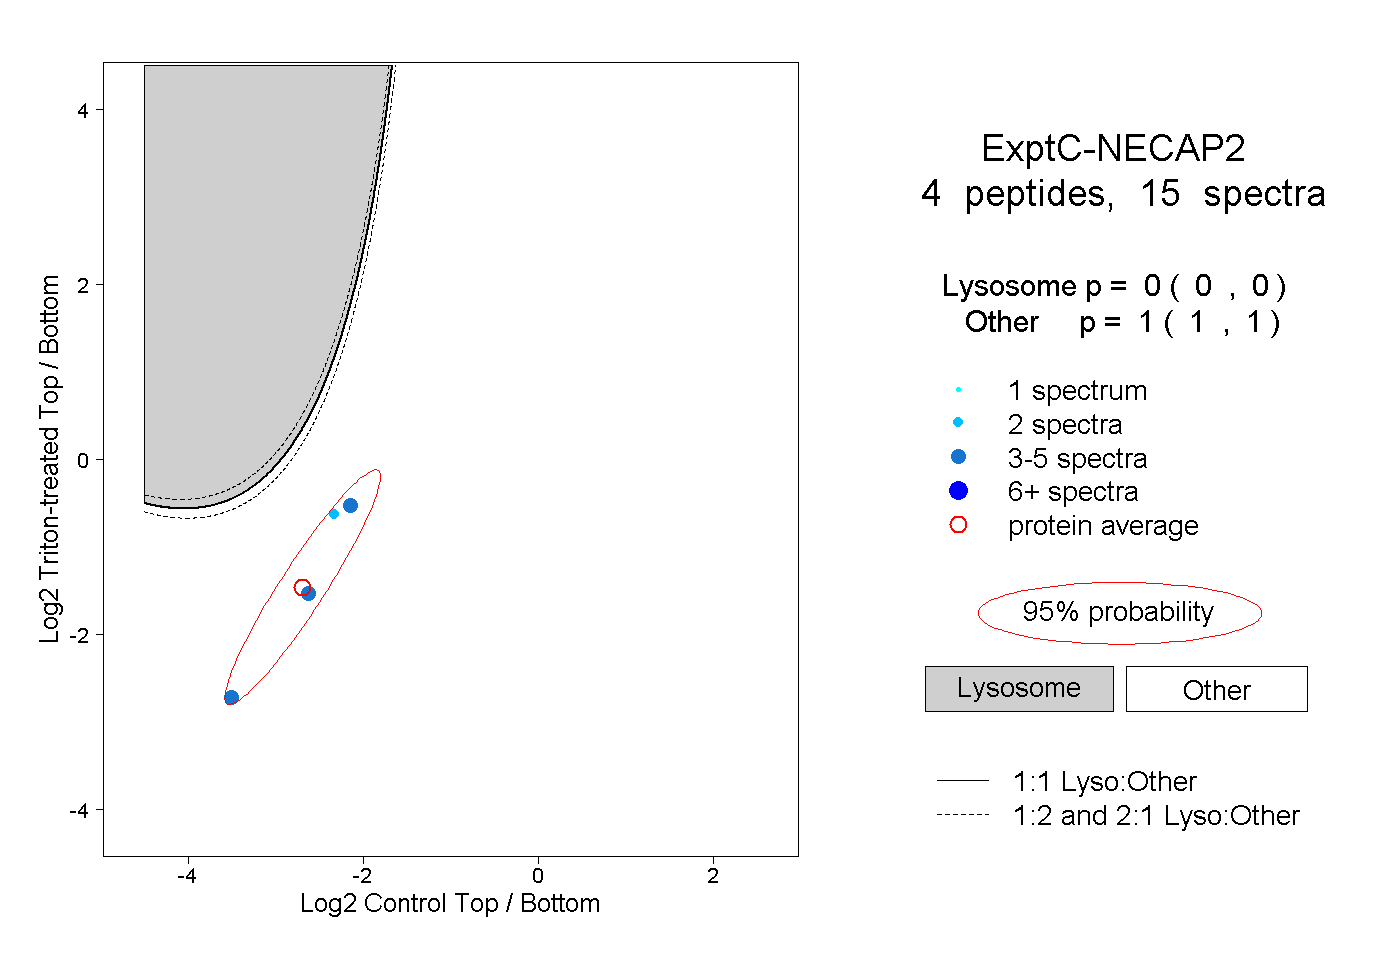 |
0.000 0.000 | 0.000 |
1.000 1.000 | 1.000 |