 6
6peptides
spectra
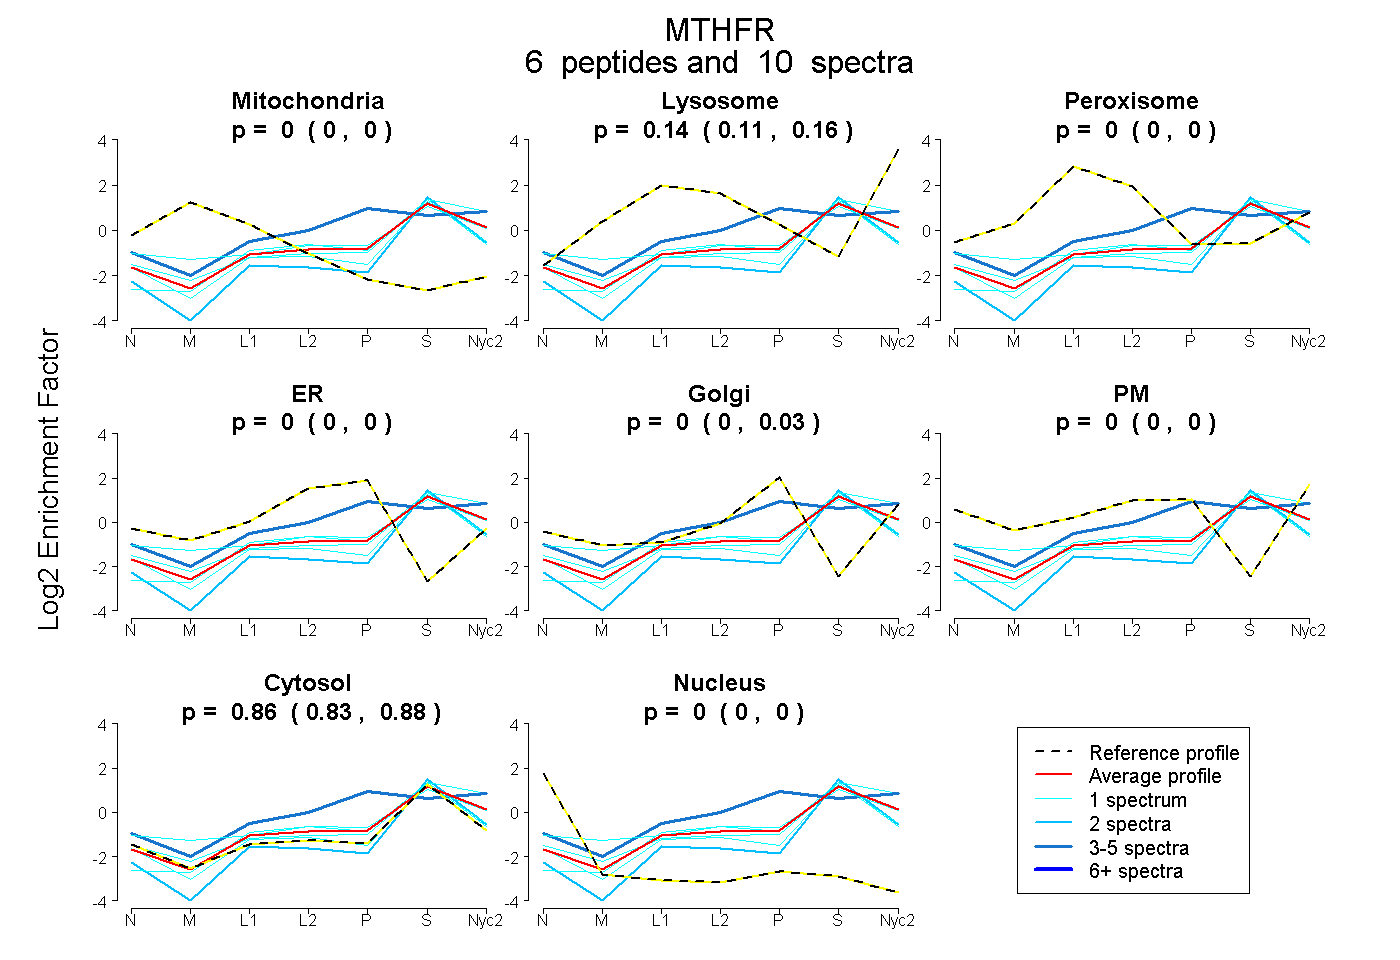
0.000 | 0.000
0.108 | 0.159
0.000 | 0.000
0.000 | 0.000
0.000 | 0.032
0.000 | 0.000
0.829 | 0.878
0.000 | 0.000
2peptides
spectra
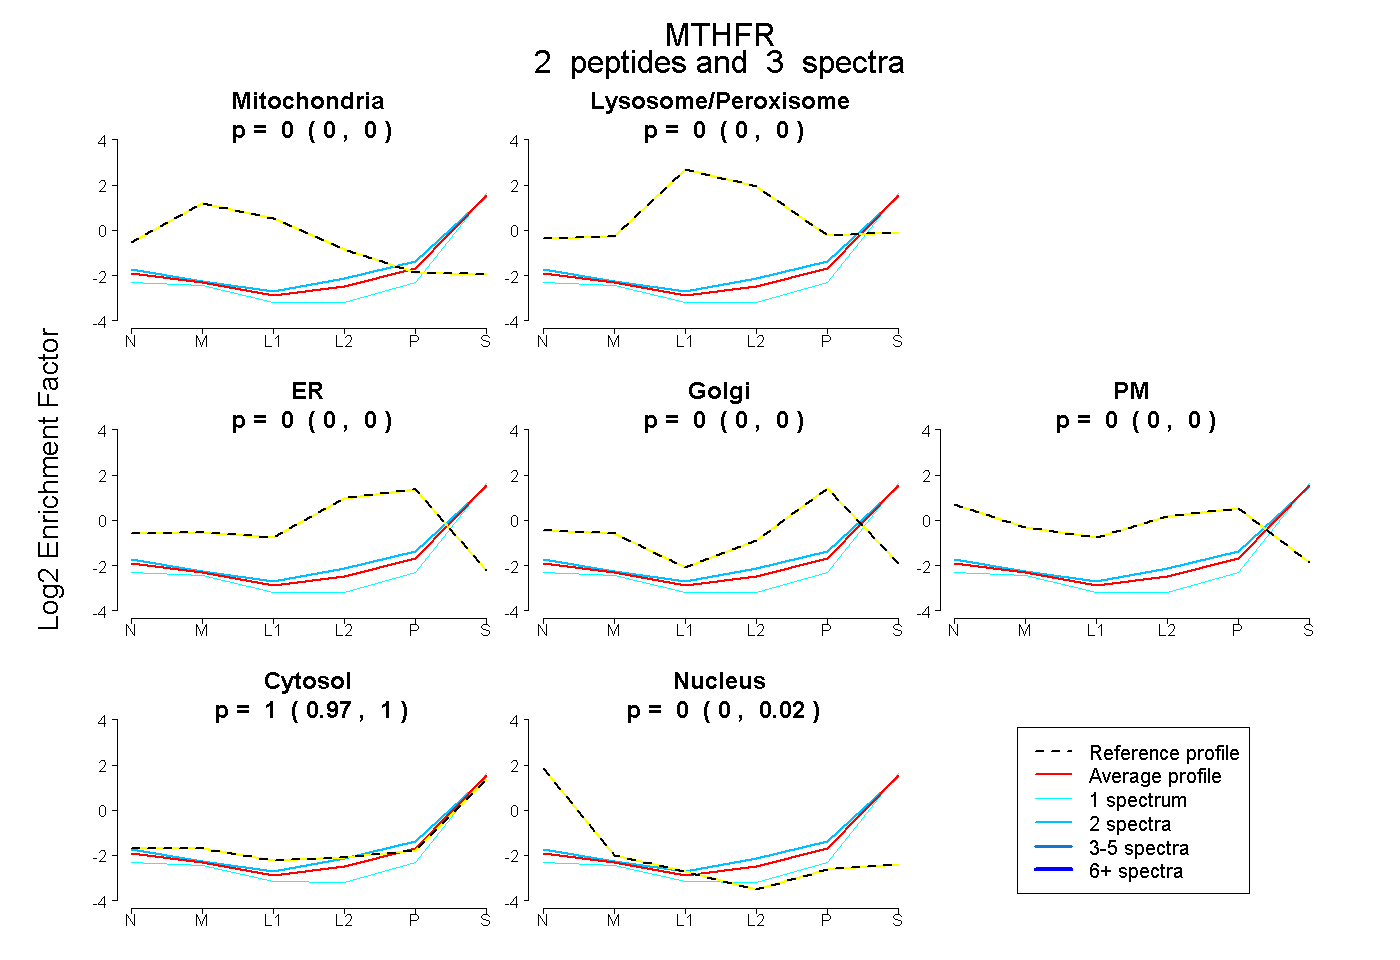
0.000 | 0.000
0.000 | 0.000
0.000 | 0.000
0.000 | 0.000
0.000 | 0.000
0.974 | 1.000
0.000 | 0.019
4peptides
spectra
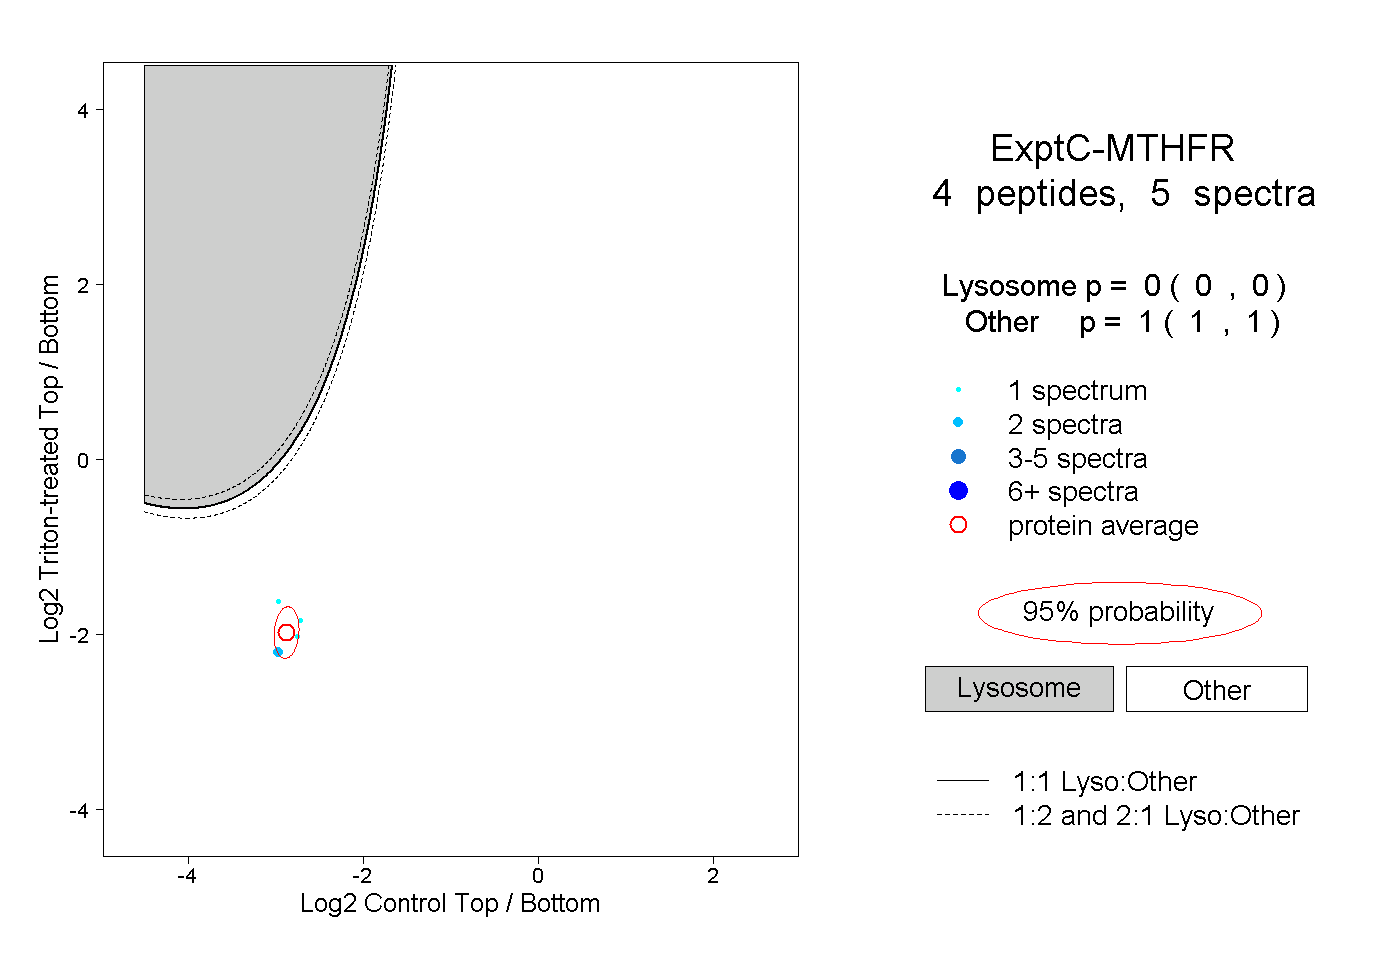
0.000 | 0.000
1.000 | 1.000