 6
6peptides
spectra
0.000 | 0.000
0.108 | 0.159
0.000 | 0.000
0.000 | 0.000
0.000 | 0.032
0.000 | 0.000
0.829 | 0.878
0.000 | 0.000
| Plot | Mito | Lyso | Perox | ER | Golgi | PM | Cytosol | Nucleus | |||||
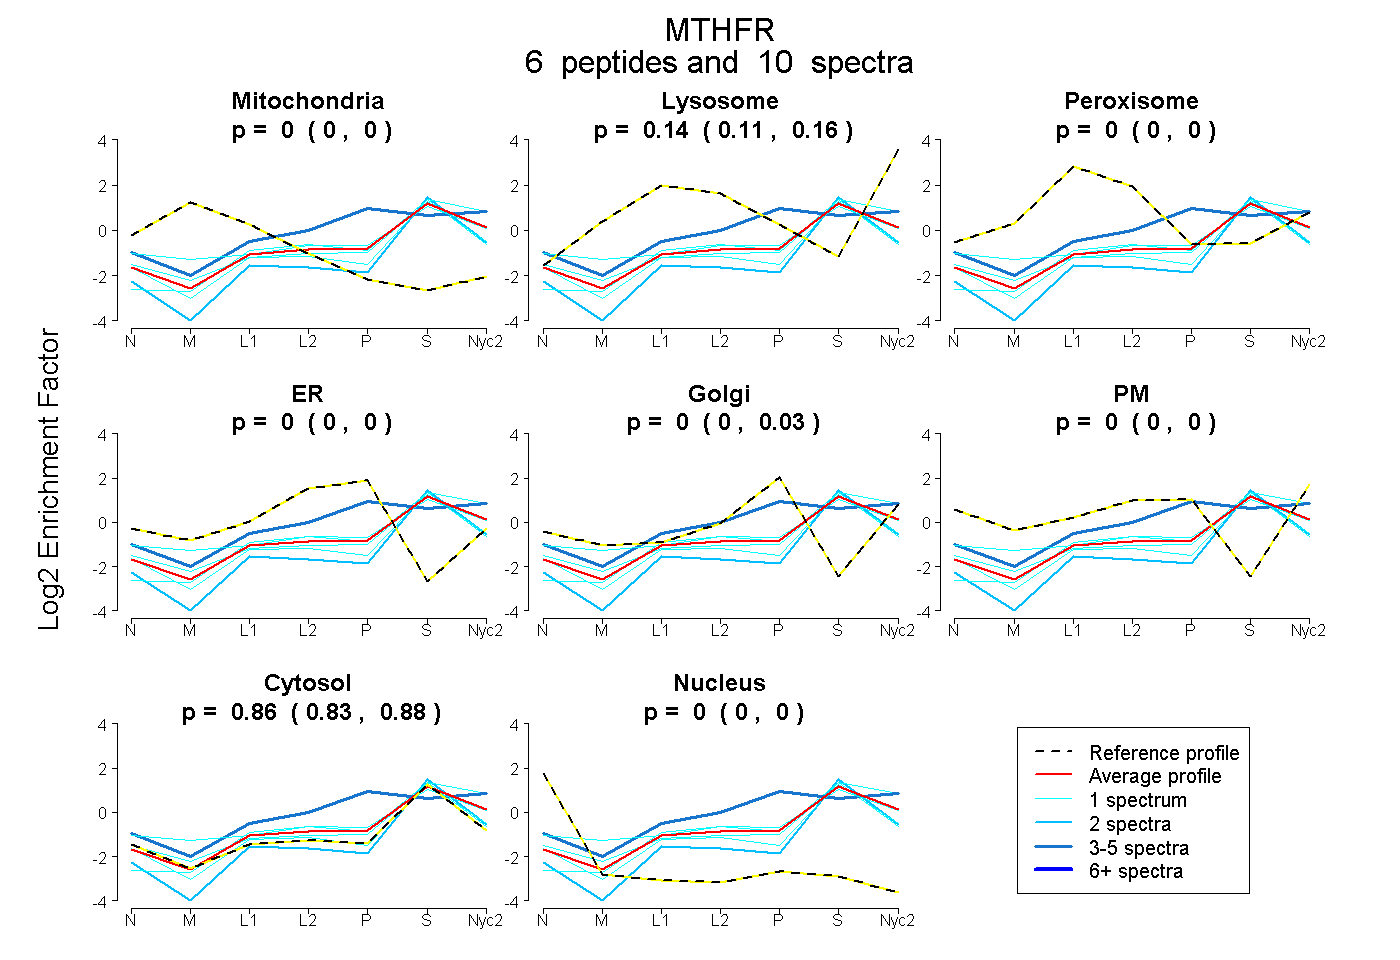
| Expt A |
6 peptides |
10 spectra |
|
0.000 0.000 | 0.000 |
0.141 0.108 | 0.159 |
0.000 0.000 | 0.000 |
0.000 0.000 | 0.000 |
0.000 0.000 | 0.032 |
0.000 0.000 | 0.000 |
0.859 0.829 | 0.878 |
0.000 0.000 | 0.000 |
| 4 spectra, NIMALR | 0.000 | 0.210 | 0.000 | 0.000 | 0.297 | 0.000 | 0.493 | 0.000 | ||
| 1 spectrum, LYEEESPSR | 0.000 | 0.077 | 0.000 | 0.000 | 0.011 | 0.000 | 0.912 | 0.000 | ||
| 2 spectra, AYLEFFTSR | 0.000 | 0.000 | 0.000 | 0.000 | 0.000 | 0.000 | 1.000 | 0.000 | ||
| 1 spectrum, QLGMWTEDPR | 0.000 | 0.154 | 0.000 | 0.000 | 0.000 | 0.092 | 0.754 | 0.000 | ||
| 1 spectrum, GHPDAESFEDDLK | 0.000 | 0.004 | 0.000 | 0.000 | 0.000 | 0.000 | 0.996 | 0.000 | ||
| 1 spectrum, EVATMEVLK | 0.000 | 0.199 | 0.000 | 0.000 | 0.000 | 0.000 | 0.801 | 0.000 |
| Plot | Mito | Lyso or Perox | ER | Golgi | PM | Cytosol | Nucleus | ||||||
| Expt B |
2 peptides |
3 spectra |
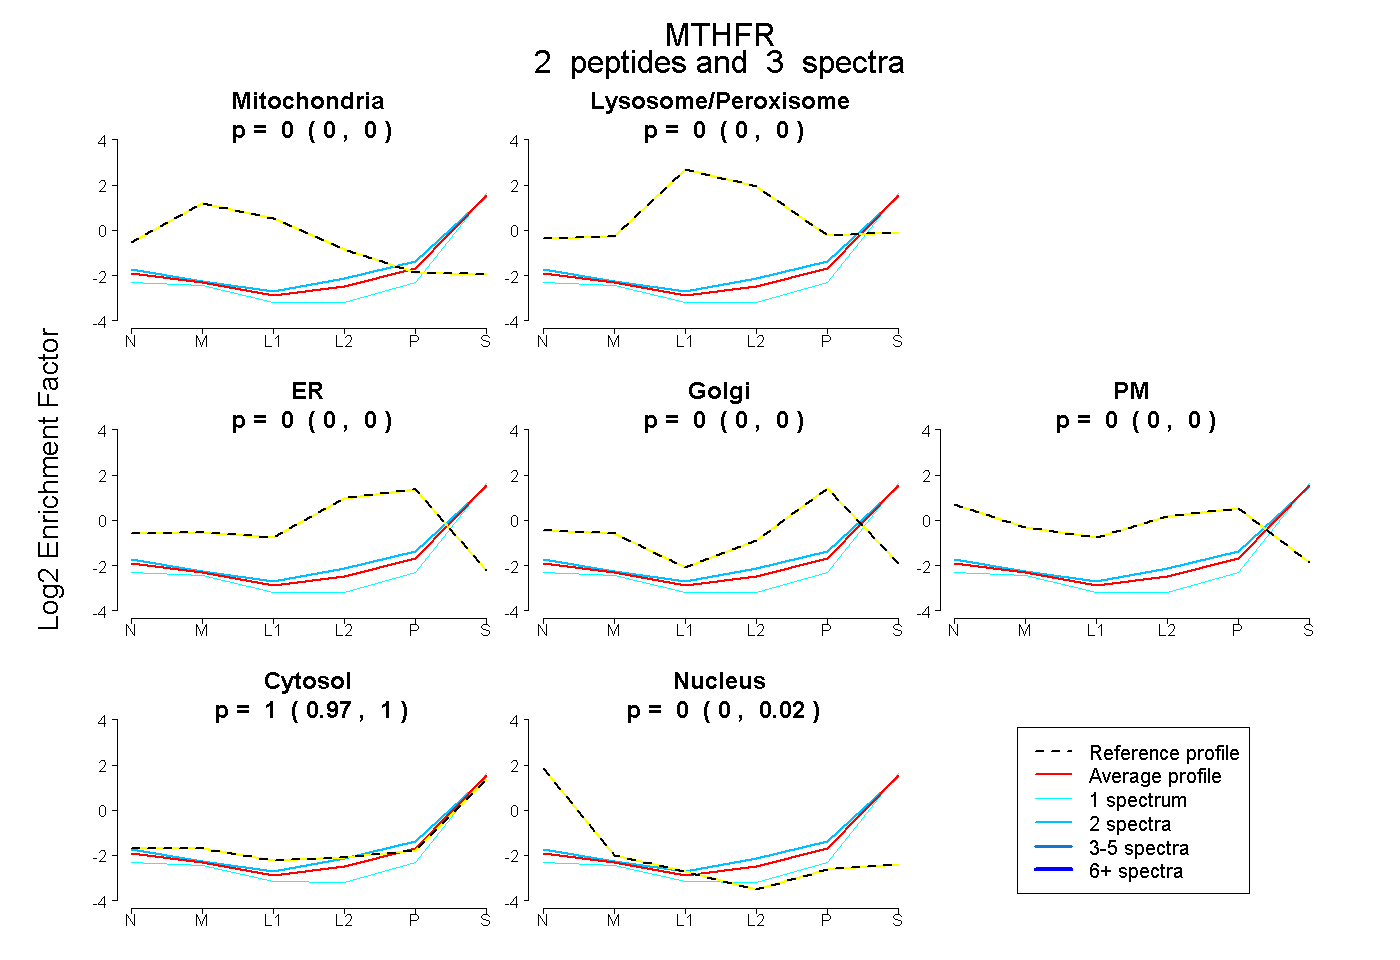 |
0.000 0.000 | 0.000 |
0.000 0.000 | 0.000 |
0.000 0.000 | 0.000 |
0.000 0.000 | 0.000 |
0.000 0.000 | 0.000 |
1.000 0.974 | 1.000 |
0.000 0.000 | 0.019 |
|||
| Plot | Lyso | Other | |||||||||||
| Expt C |
4 peptides |
5 spectra |
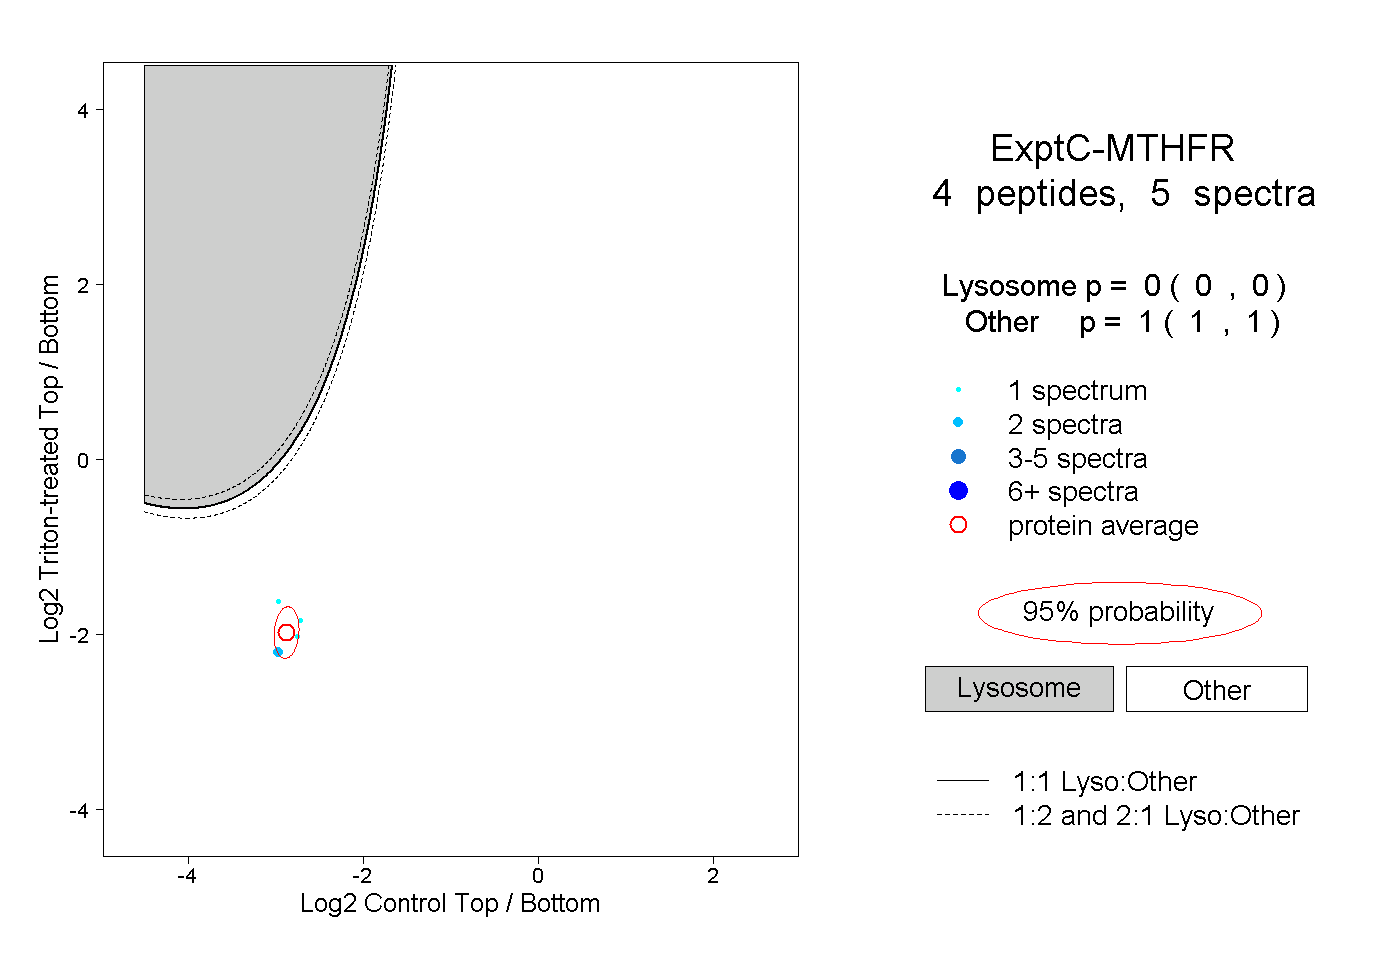 |
0.000 0.000 | 0.000 |
1.000 1.000 | 1.000 |