 4
4peptides
spectra
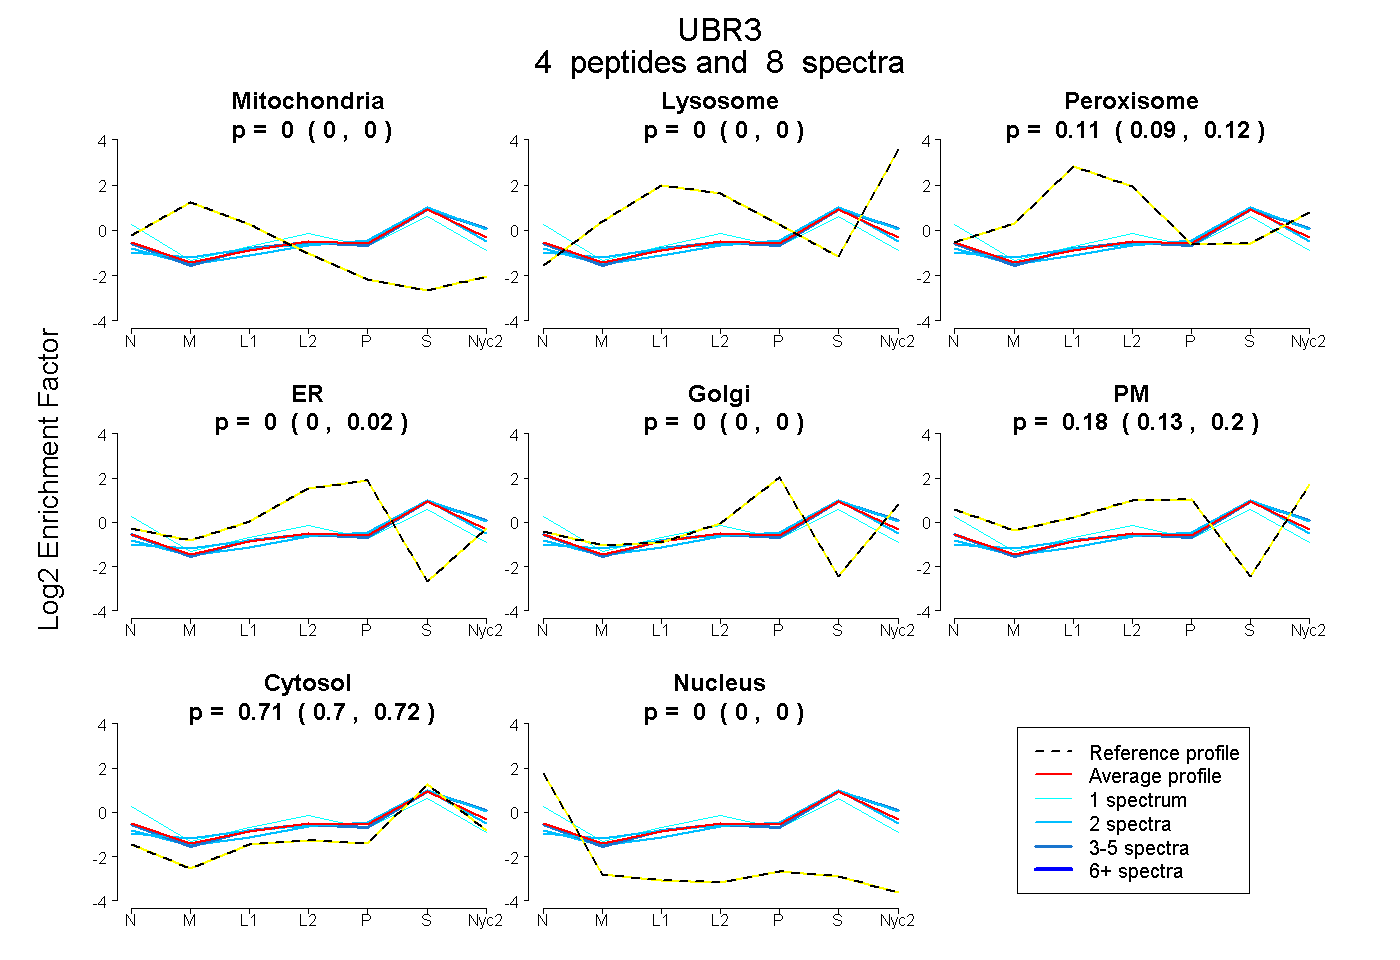
0.000 | 0.000
0.000 | 0.000
0.086 | 0.124
0.000 | 0.018
0.000 | 0.000
0.128 | 0.204
0.695 | 0.724
0.000 | 0.000
1peptide
spectra
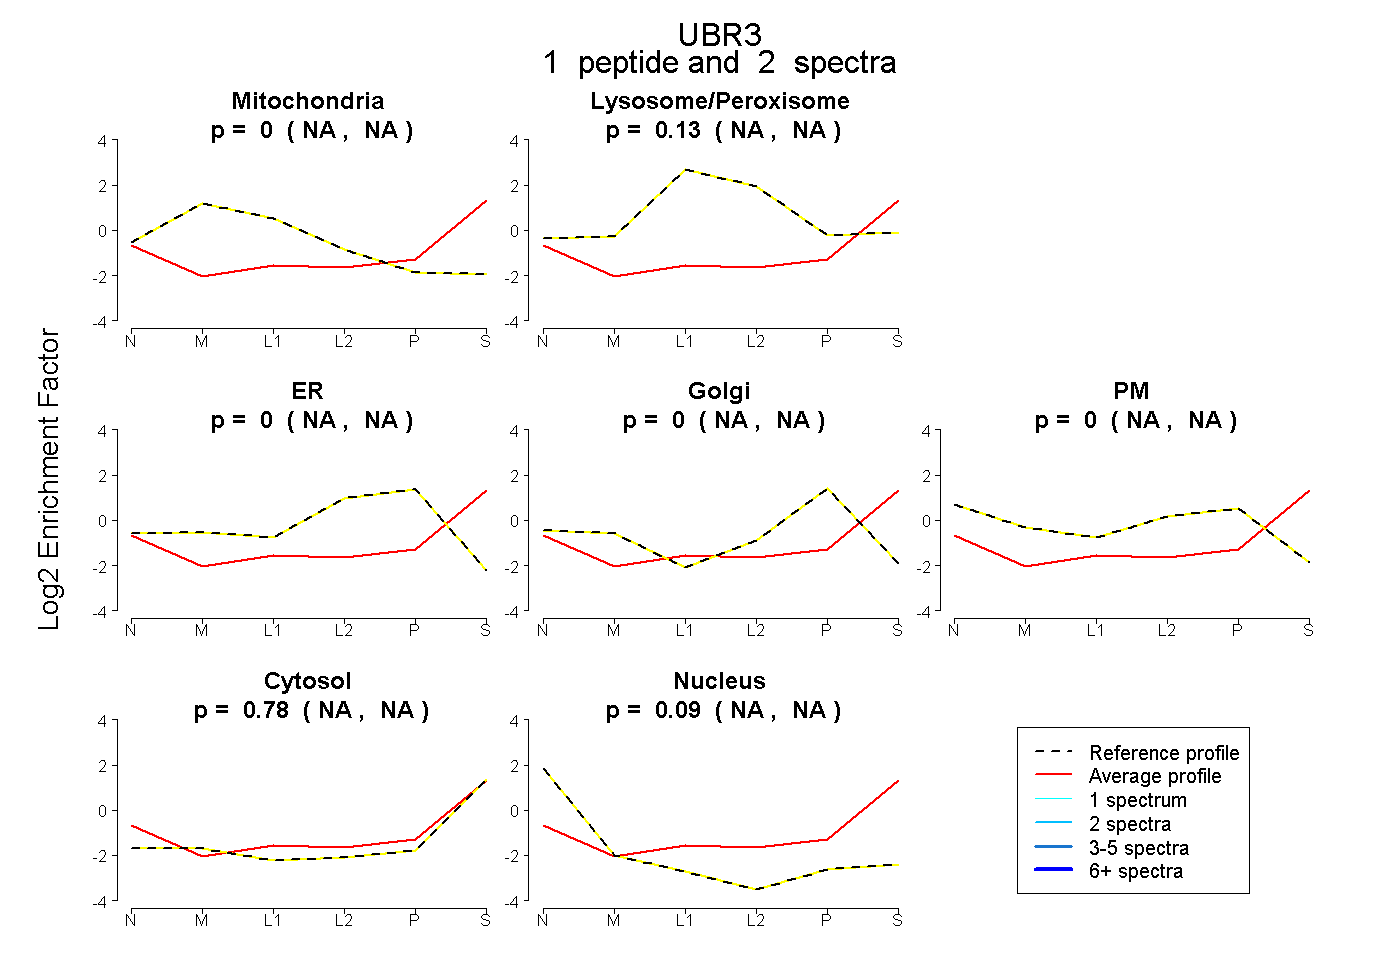
NA | NA
NA | NA
NA | NA
NA | NA
NA | NA
NA | NA
NA | NA
5peptides
spectra
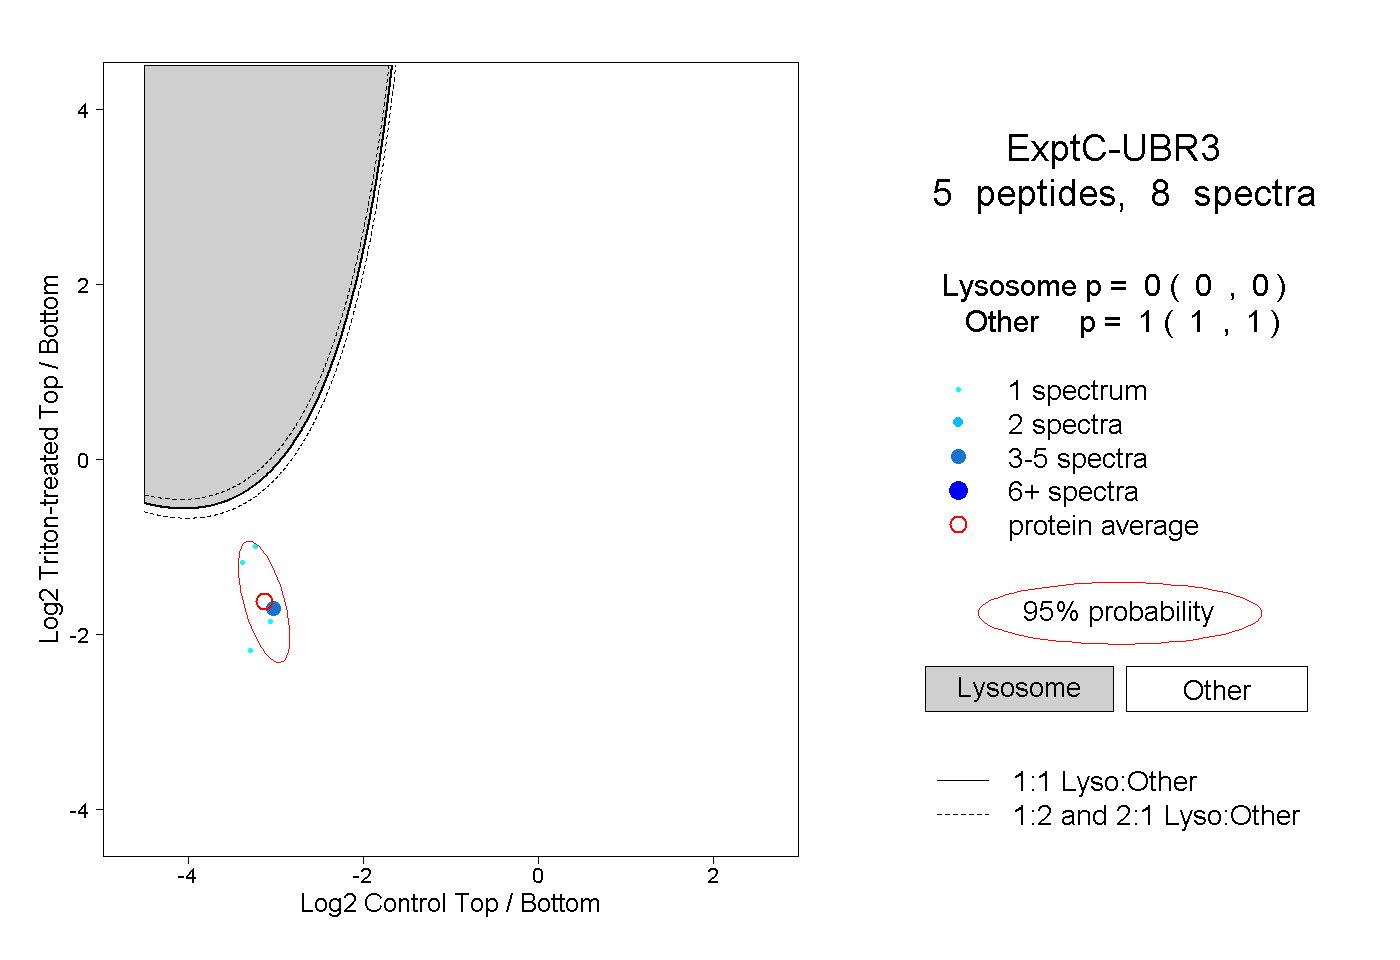
0.000 | 0.000
1.000 | 1.000