 4
4peptides
spectra
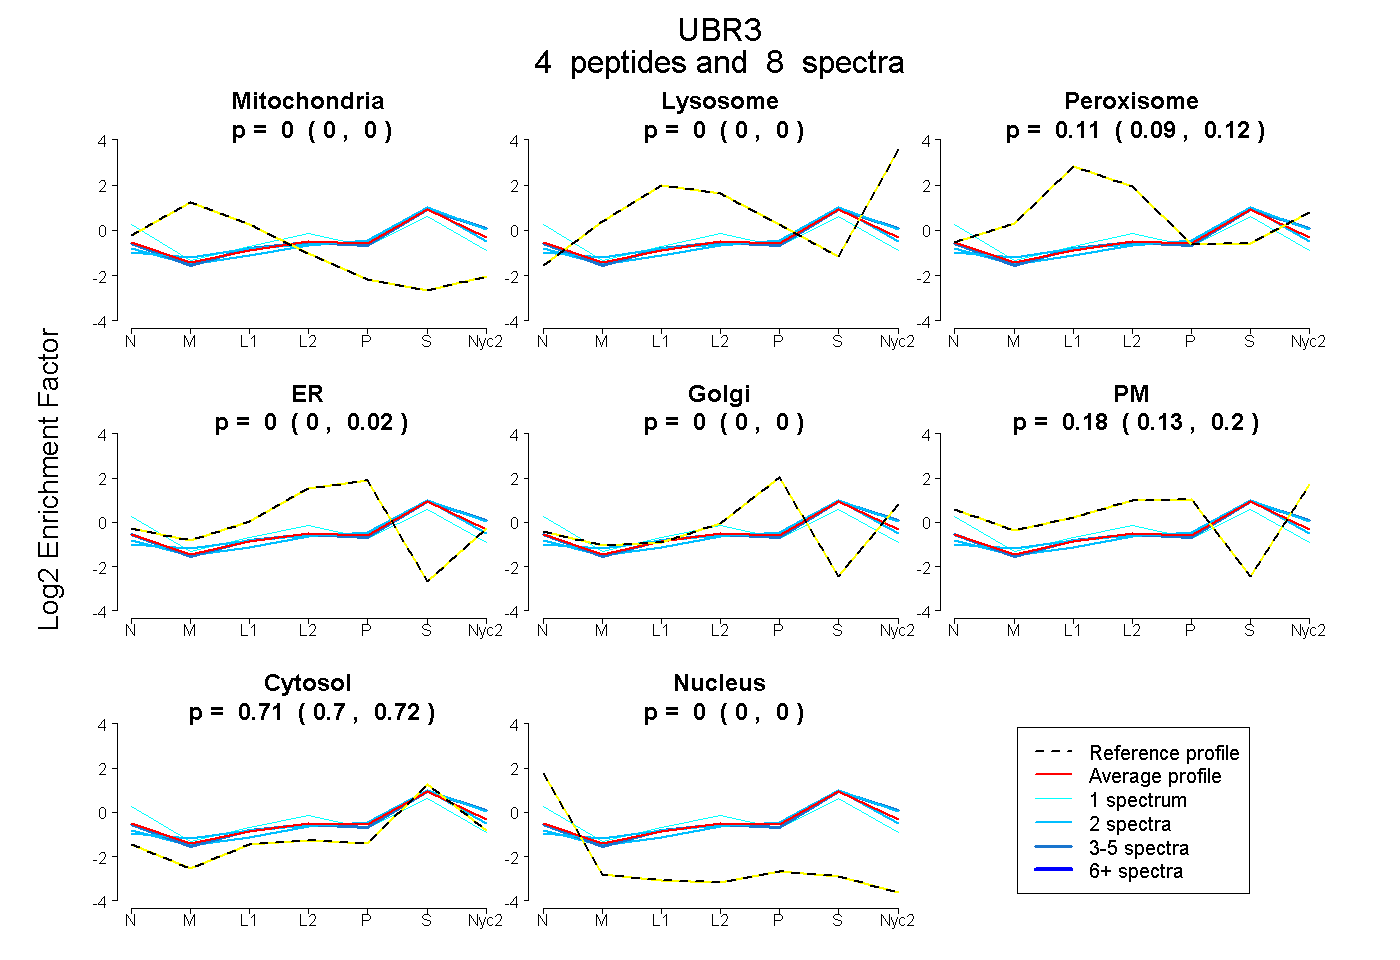
0.000 | 0.000
0.000 | 0.000
0.086 | 0.124
0.000 | 0.018
0.000 | 0.000
0.128 | 0.204
0.695 | 0.724
0.000 | 0.000
| Plot | Mito | Lyso | Perox | ER | Golgi | PM | Cytosol | Nucleus | |||||
| Expt A |
4 peptides |
8 spectra |
|
0.000 0.000 | 0.000 |
0.000 0.000 | 0.000 |
0.105 0.086 | 0.124 |
0.000 0.000 | 0.018 |
0.000 0.000 | 0.000 |
0.183 0.128 | 0.204 |
0.712 0.695 | 0.724 |
0.000 0.000 | 0.000 |
| 2 spectra, HFINYVR | 0.000 | 0.000 | 0.094 | 0.009 | 0.116 | 0.042 | 0.739 | 0.000 | ||
| 1 spectrum, DVQSAMDR | 0.000 | 0.000 | 0.242 | 0.060 | 0.000 | 0.056 | 0.519 | 0.124 | ||
| 2 spectra, YTAFLK | 0.000 | 0.125 | 0.069 | 0.000 | 0.062 | 0.043 | 0.701 | 0.000 | ||
| 3 spectra, HLGALK | 0.000 | 0.032 | 0.080 | 0.000 | 0.000 | 0.179 | 0.710 | 0.000 |
| Plot | Mito | Lyso or Perox | ER | Golgi | PM | Cytosol | Nucleus | ||||||
| Expt B |
1 peptide |
2 spectra |
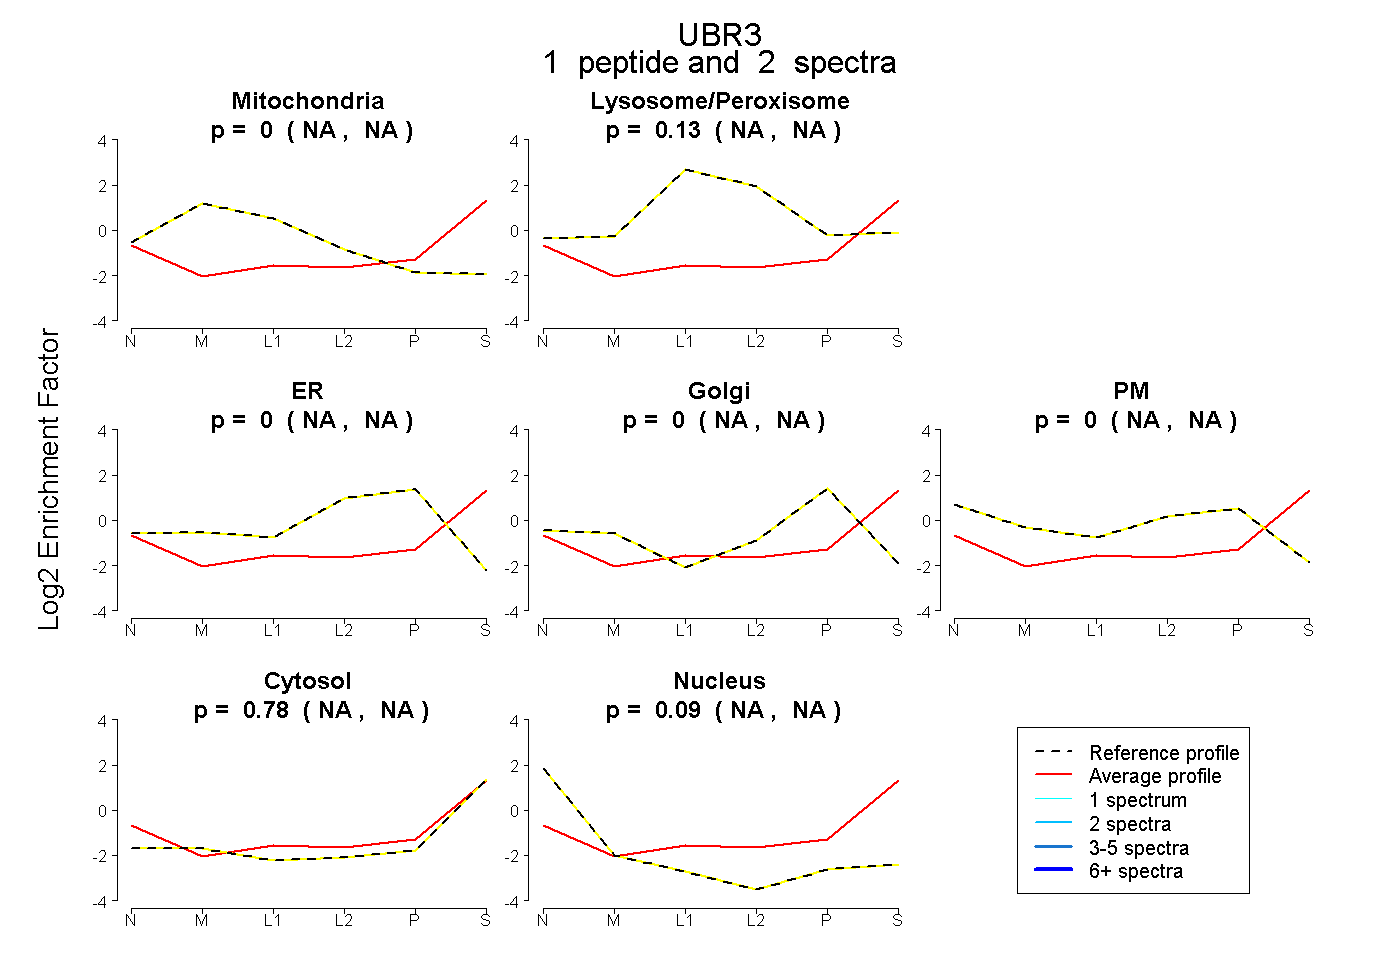 |
0.000 NA | NA |
0.134 NA | NA |
0.000 NA | NA |
0.000 NA | NA |
0.000 NA | NA |
0.780 NA | NA |
0.085 NA | NA |
|||
| Plot | Lyso | Other | |||||||||||
| Expt C |
5 peptides |
8 spectra |
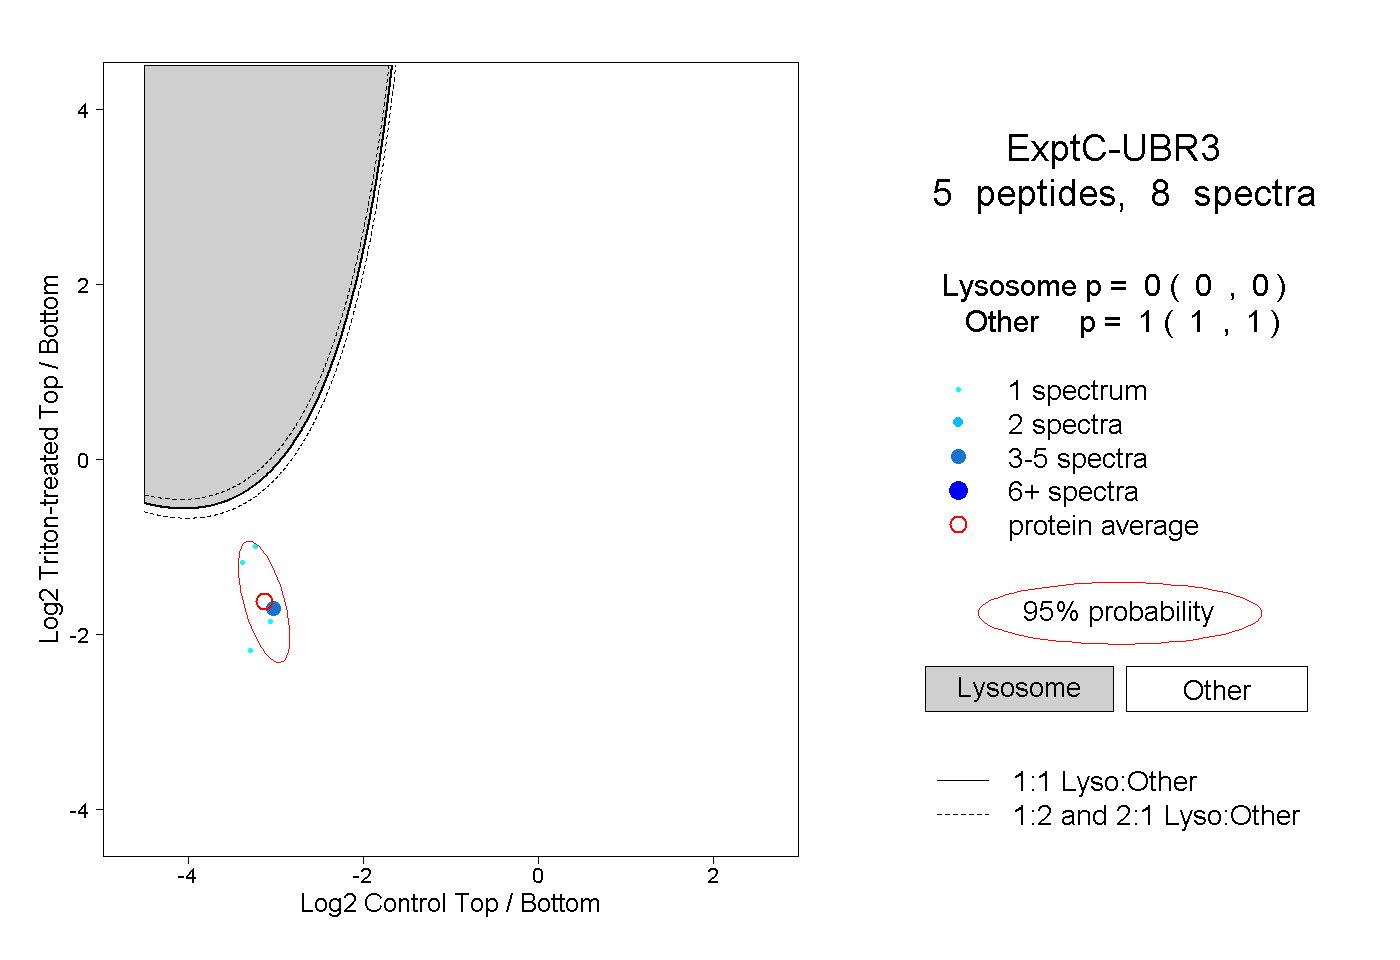 |
0.000 0.000 | 0.000 |
1.000 1.000 | 1.000 |