 7
7peptides
spectra
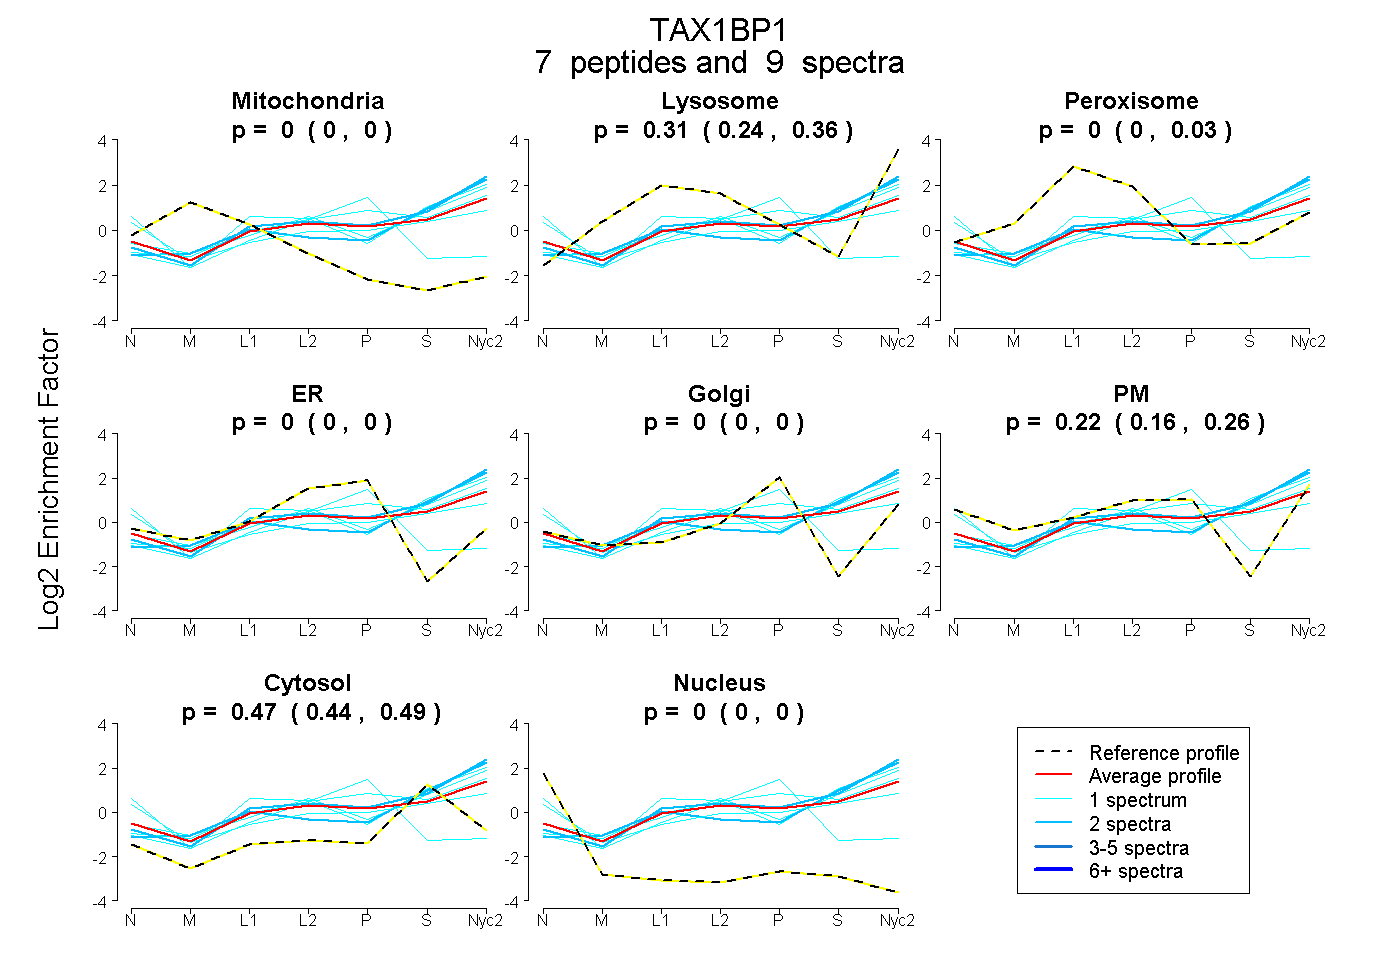
0.000 | 0.000
0.243 | 0.359
0.000 | 0.027
0.000 | 0.000
0.000 | 0.000
0.158 | 0.263
0.438 | 0.491
0.000 | 0.000
1peptide
spectra
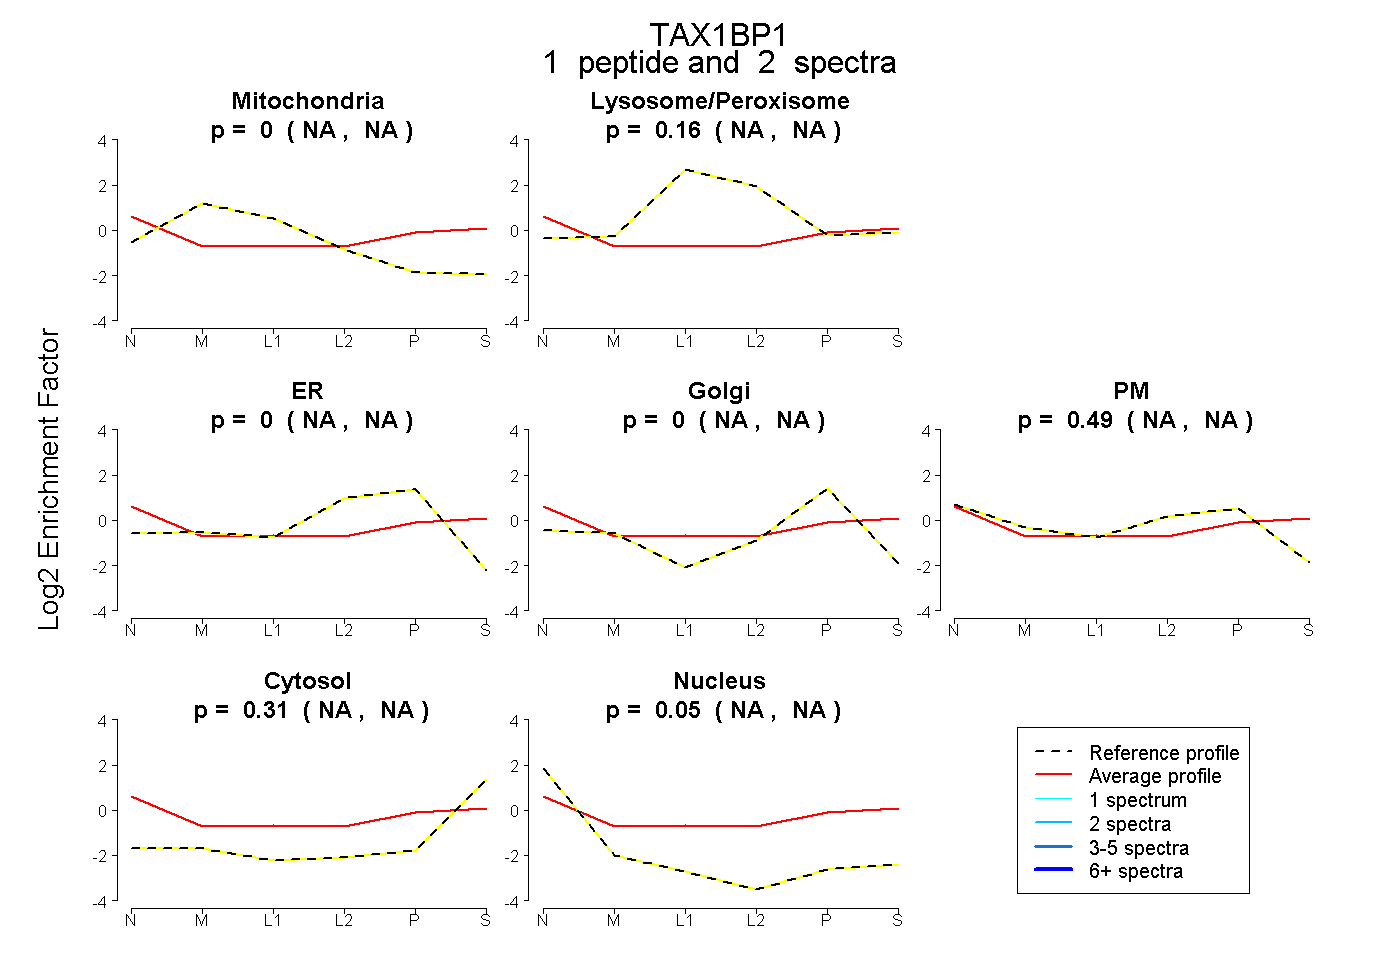
NA | NA
NA | NA
NA | NA
NA | NA
NA | NA
NA | NA
NA | NA
12peptides
spectra
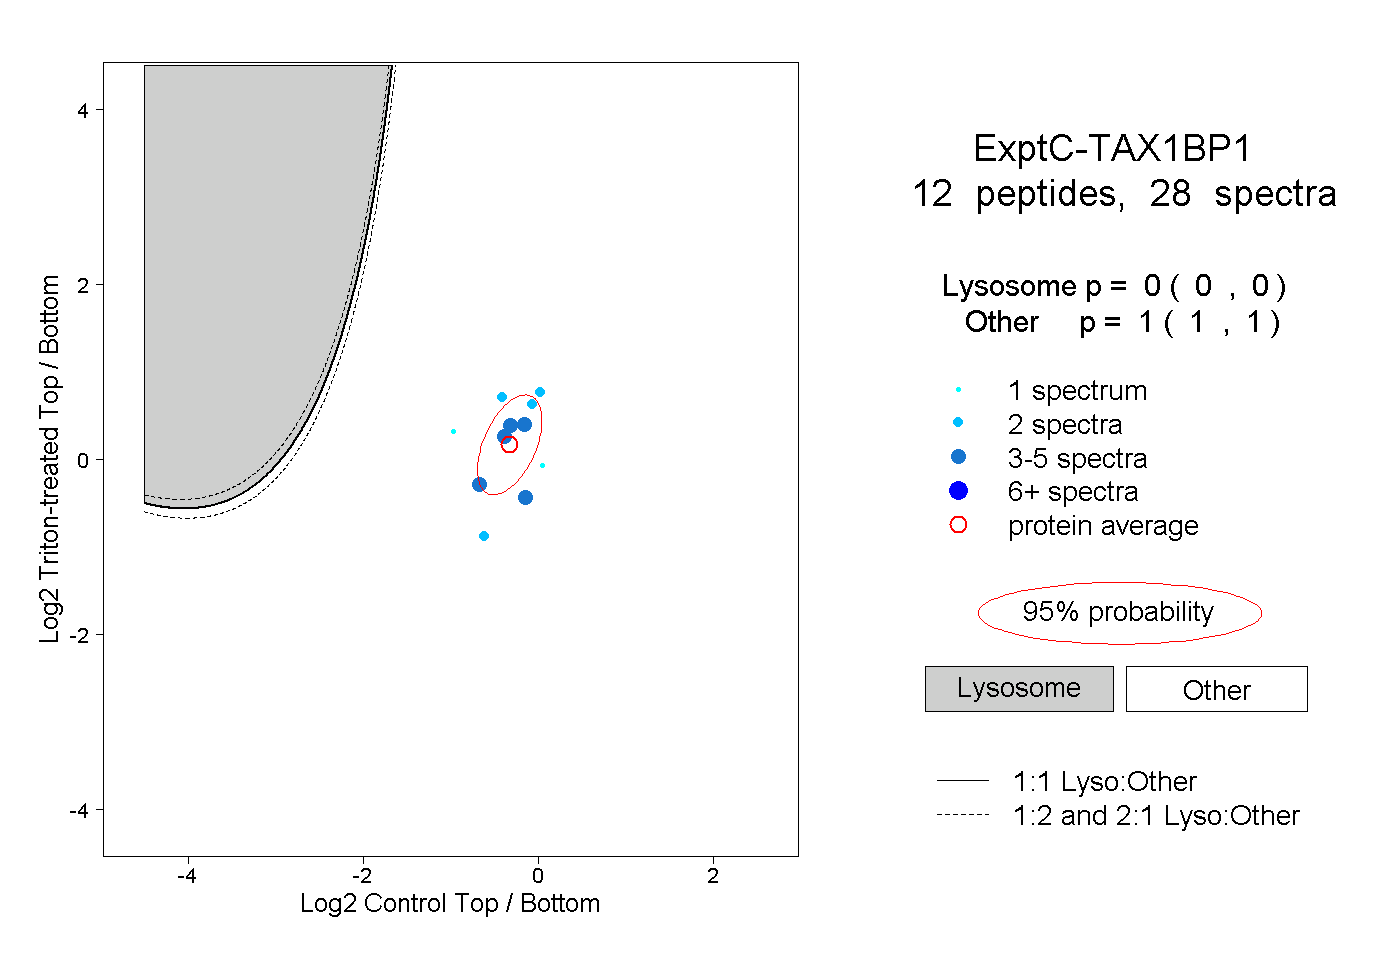
0.000 | 0.000
1.000 | 1.000