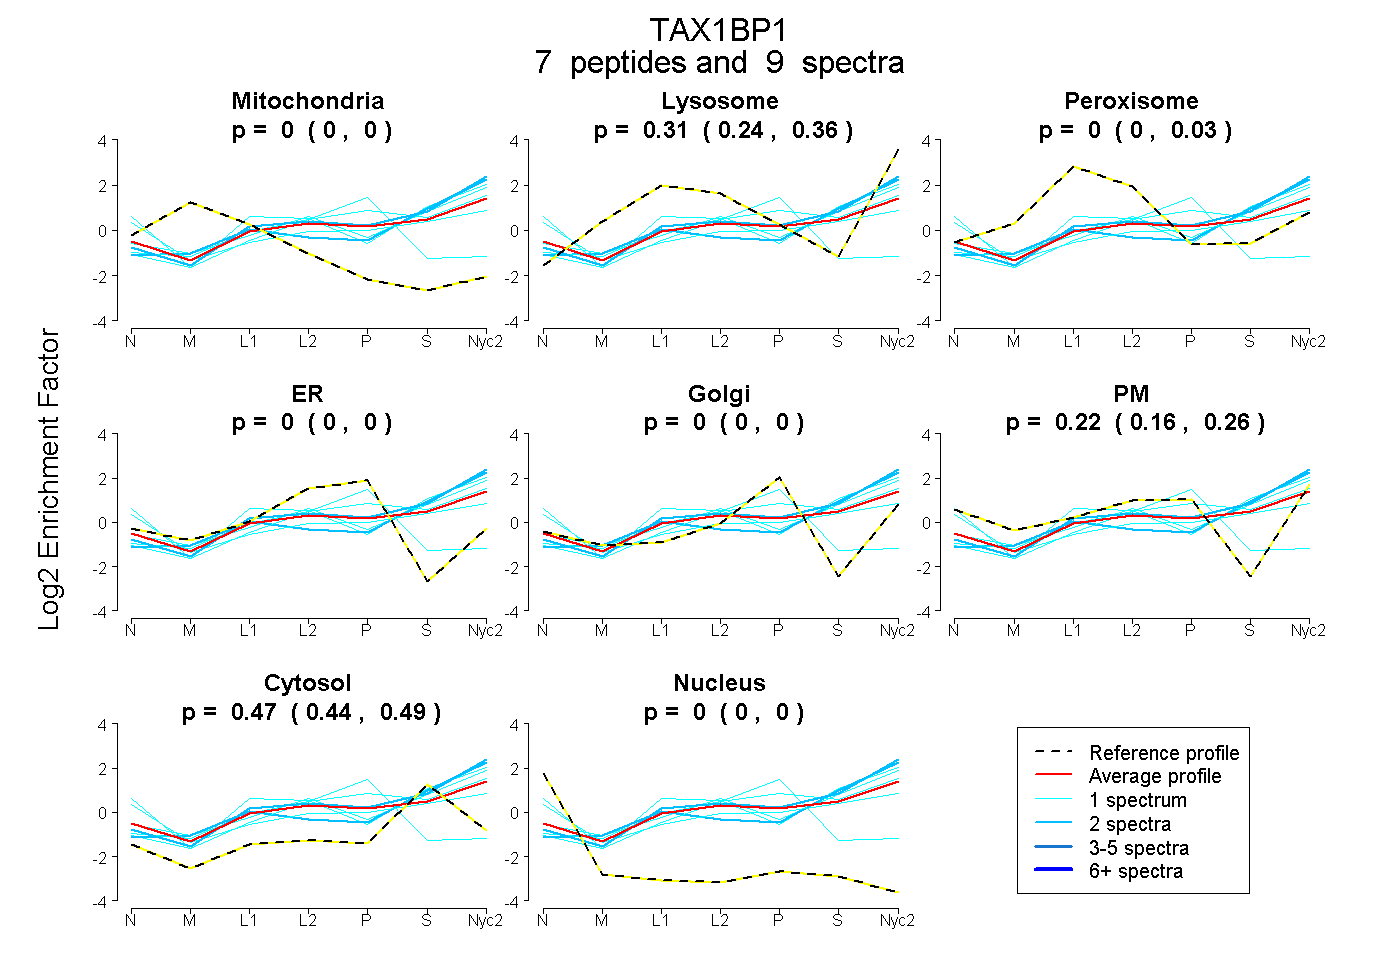
 7
7peptides
spectra
0.000 | 0.000
0.243 | 0.359
0.000 | 0.027
0.000 | 0.000
0.000 | 0.000
0.158 | 0.263
0.438 | 0.491
0.000 | 0.000
| Plot | Mito | Lyso | Perox | ER | Golgi | PM | Cytosol | Nucleus | |||||
| Expt A |
7 peptides |
9 spectra |
|
0.000 0.000 | 0.000 |
0.313 0.243 | 0.359 |
0.000 0.000 | 0.027 |
0.000 0.000 | 0.000 |
0.000 0.000 | 0.000 |
0.219 0.158 | 0.263 |
0.468 0.438 | 0.491 |
0.000 0.000 | 0.000 |
| 2 spectra, VGWSTAR | 0.000 | 0.527 | 0.000 | 0.000 | 0.000 | 0.027 | 0.446 | 0.000 | ||
| 1 spectrum, ELSDAVNVR | 0.000 | 0.000 | 0.000 | 0.703 | 0.000 | 0.000 | 0.183 | 0.114 | ||
| 1 spectrum, AHQLEEDIVSVTHK | 0.000 | 0.520 | 0.000 | 0.000 | 0.000 | 0.000 | 0.480 | 0.000 | ||
| 1 spectrum, VENEEFMK | 0.000 | 0.410 | 0.000 | 0.000 | 0.200 | 0.000 | 0.390 | 0.000 | ||
| 1 spectrum, FEEHVESHWK | 0.000 | 0.018 | 0.030 | 0.000 | 0.000 | 0.455 | 0.496 | 0.000 | ||
| 1 spectrum, AEEQVQATR | 0.000 | 0.452 | 0.000 | 0.000 | 0.000 | 0.078 | 0.470 | 0.000 | ||
| 2 spectra, DWVGIFK | 0.000 | 0.497 | 0.000 | 0.000 | 0.000 | 0.000 | 0.503 | 0.000 |
| Plot | Mito | Lyso or Perox | ER | Golgi | PM | Cytosol | Nucleus | ||||||
| Expt B |
1 peptide |
2 spectra |
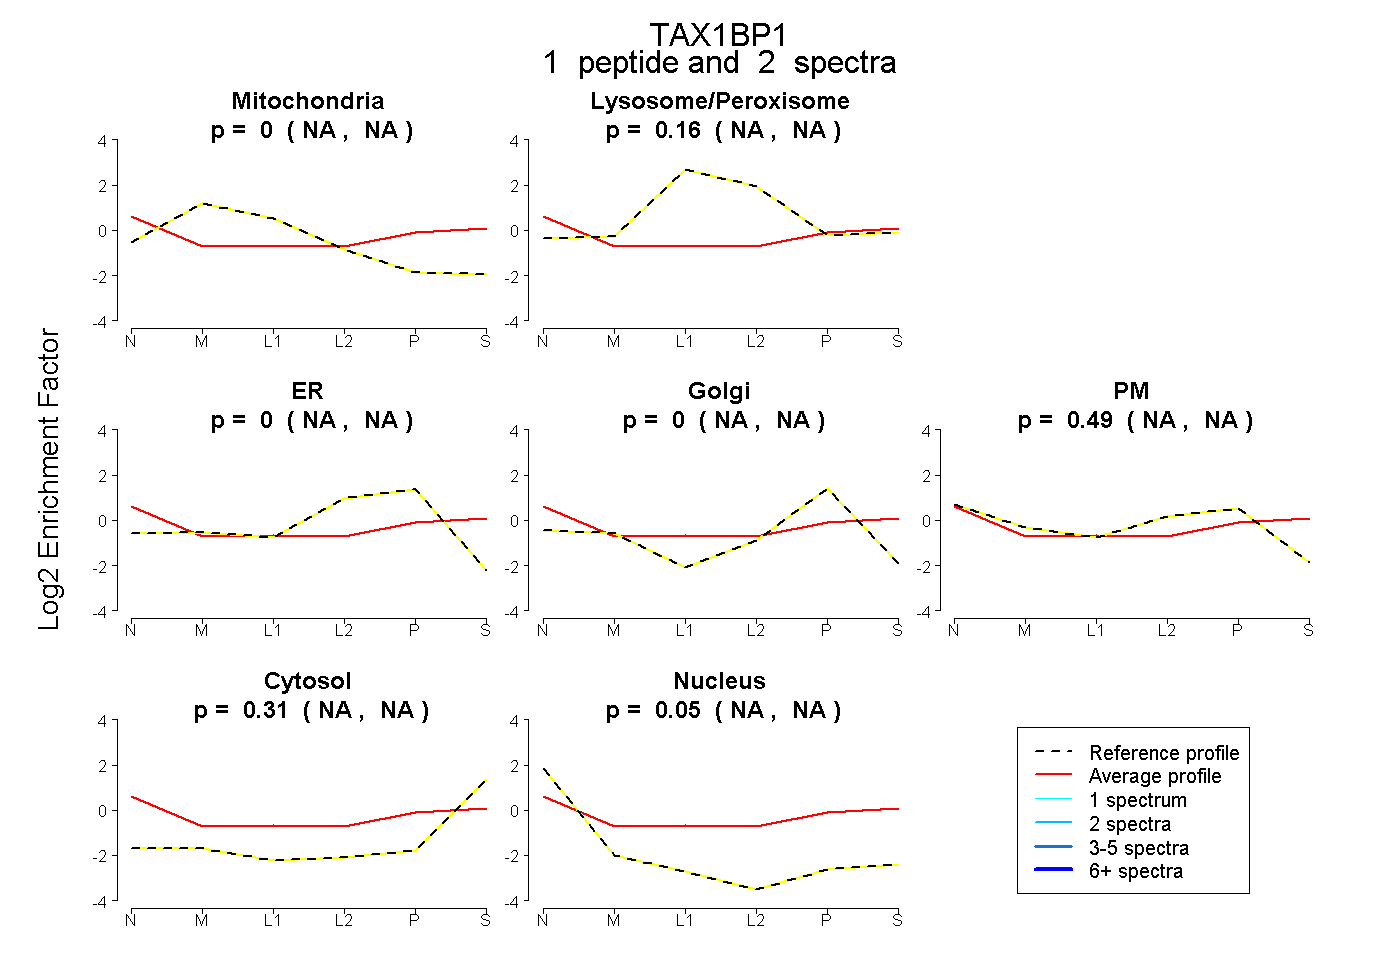 |
0.000 NA | NA |
0.156 NA | NA |
0.000 NA | NA |
0.000 NA | NA |
0.488 NA | NA |
0.308 NA | NA |
0.048 NA | NA |
|||
| Plot | Lyso | Other | |||||||||||
| Expt C |
12 peptides |
28 spectra |
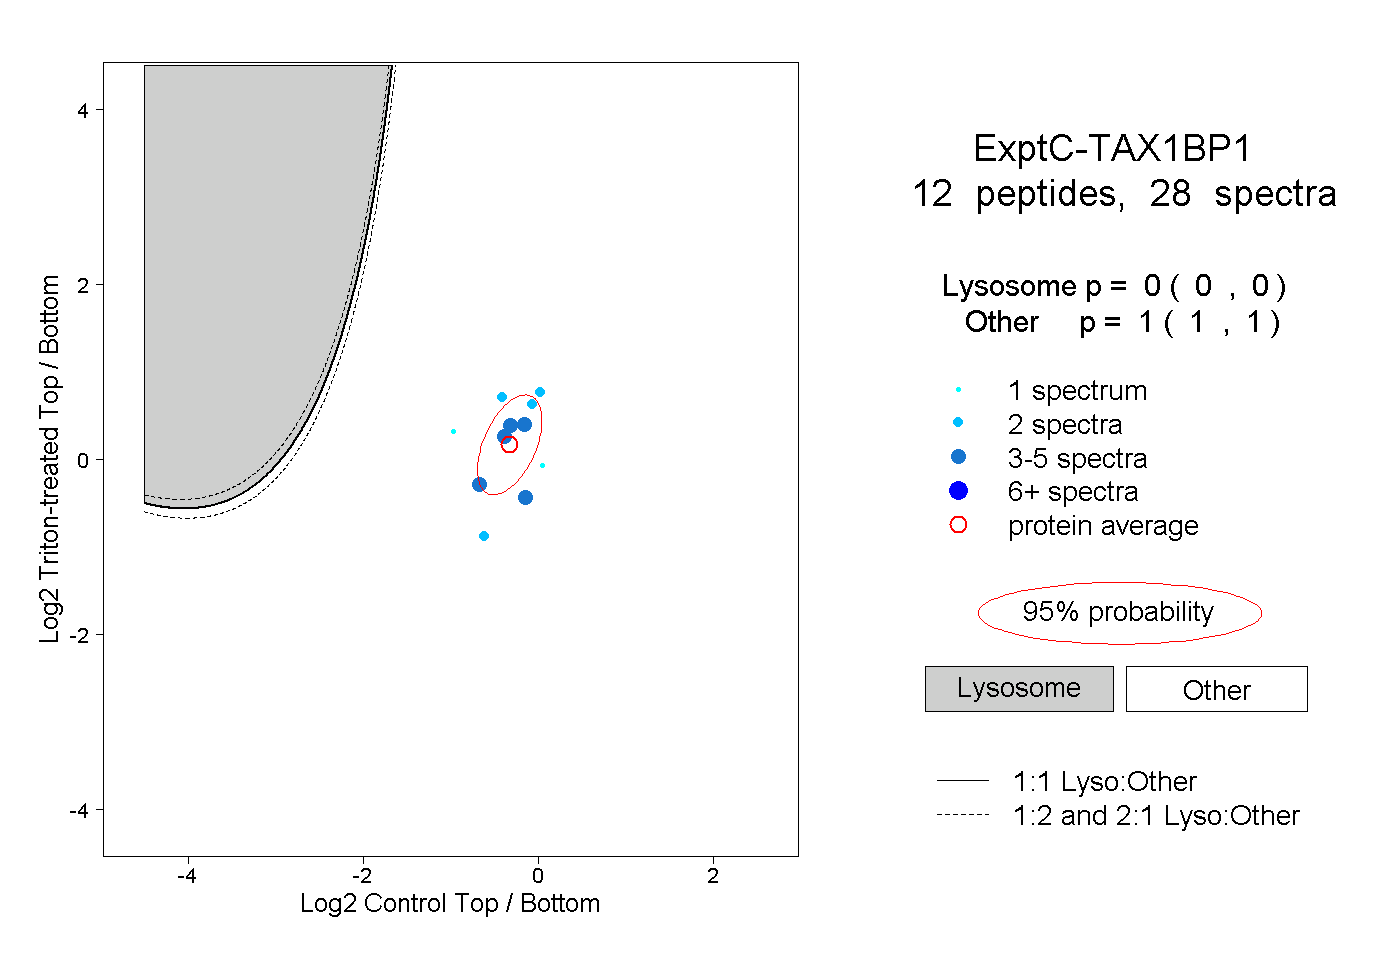 |
0.000 0.000 | 0.000 |
1.000 1.000 | 1.000 |