 13
13peptides
spectra
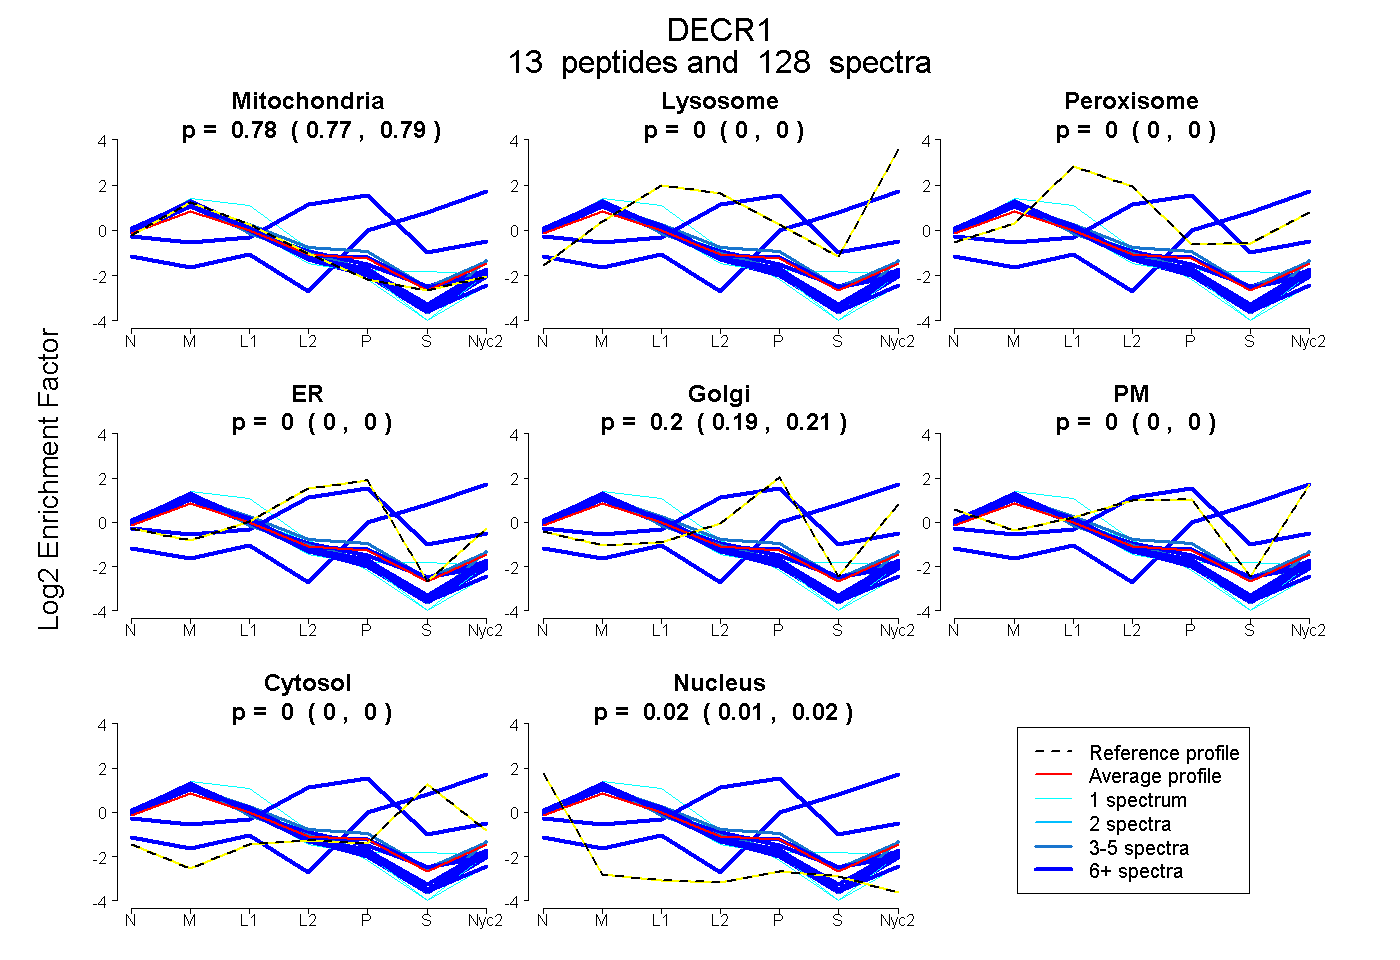
0.774 | 0.791
0.000 | 0.000
0.000 | 0.000
0.000 | 0.000
0.190 | 0.207
0.000 | 0.000
0.000 | 0.000
0.010 | 0.022
11peptides
spectra
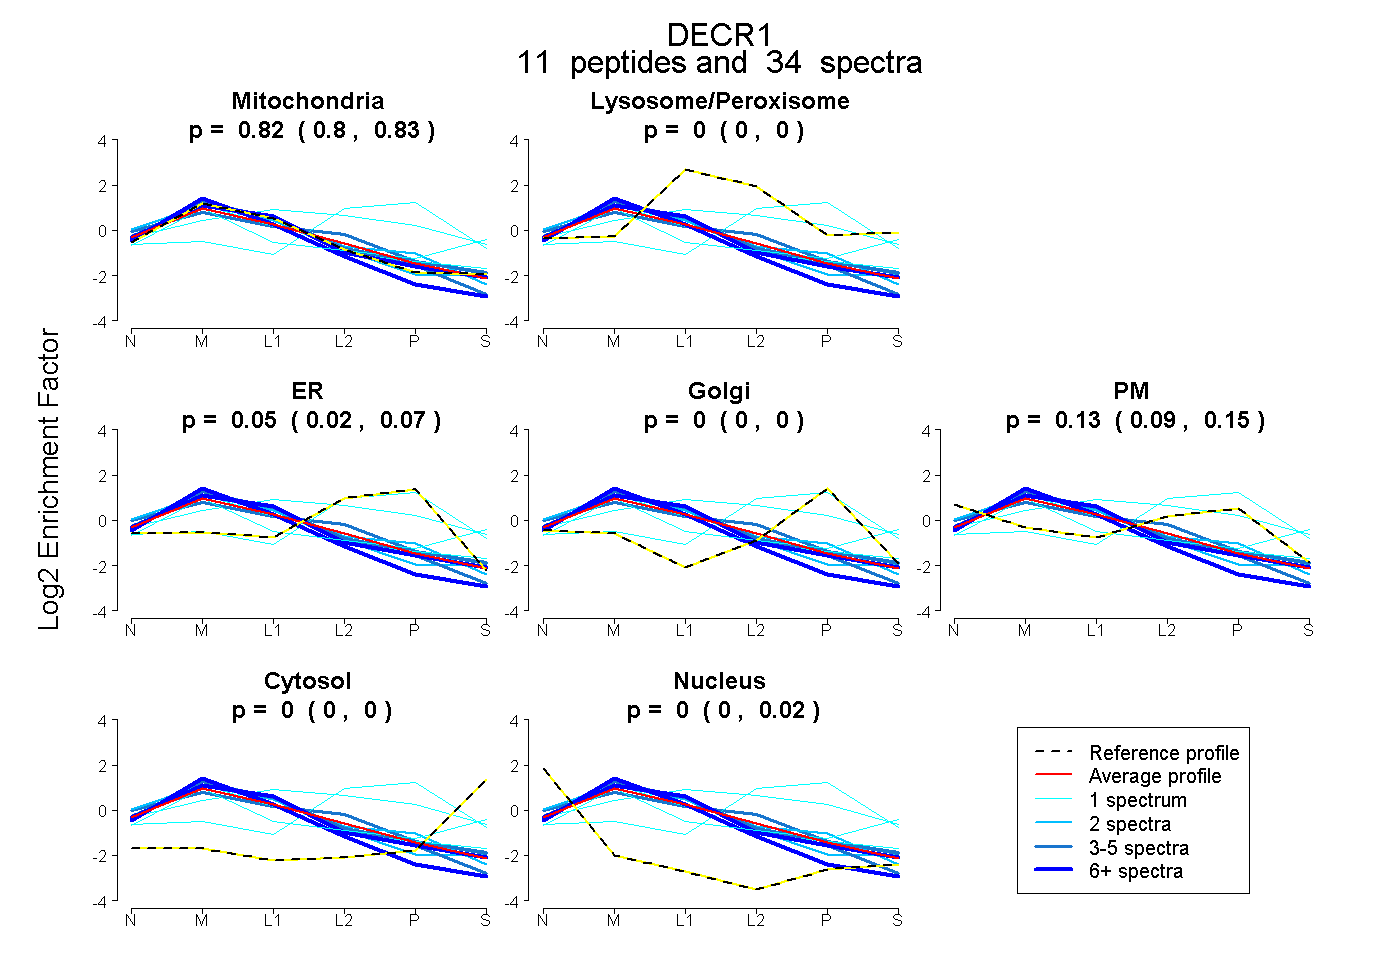
0.802 | 0.833
0.000 | 0.000
0.023 | 0.071
0.000 | 0.000
0.093 | 0.152
0.000 | 0.000
0.000 | 0.016
15peptides
spectra
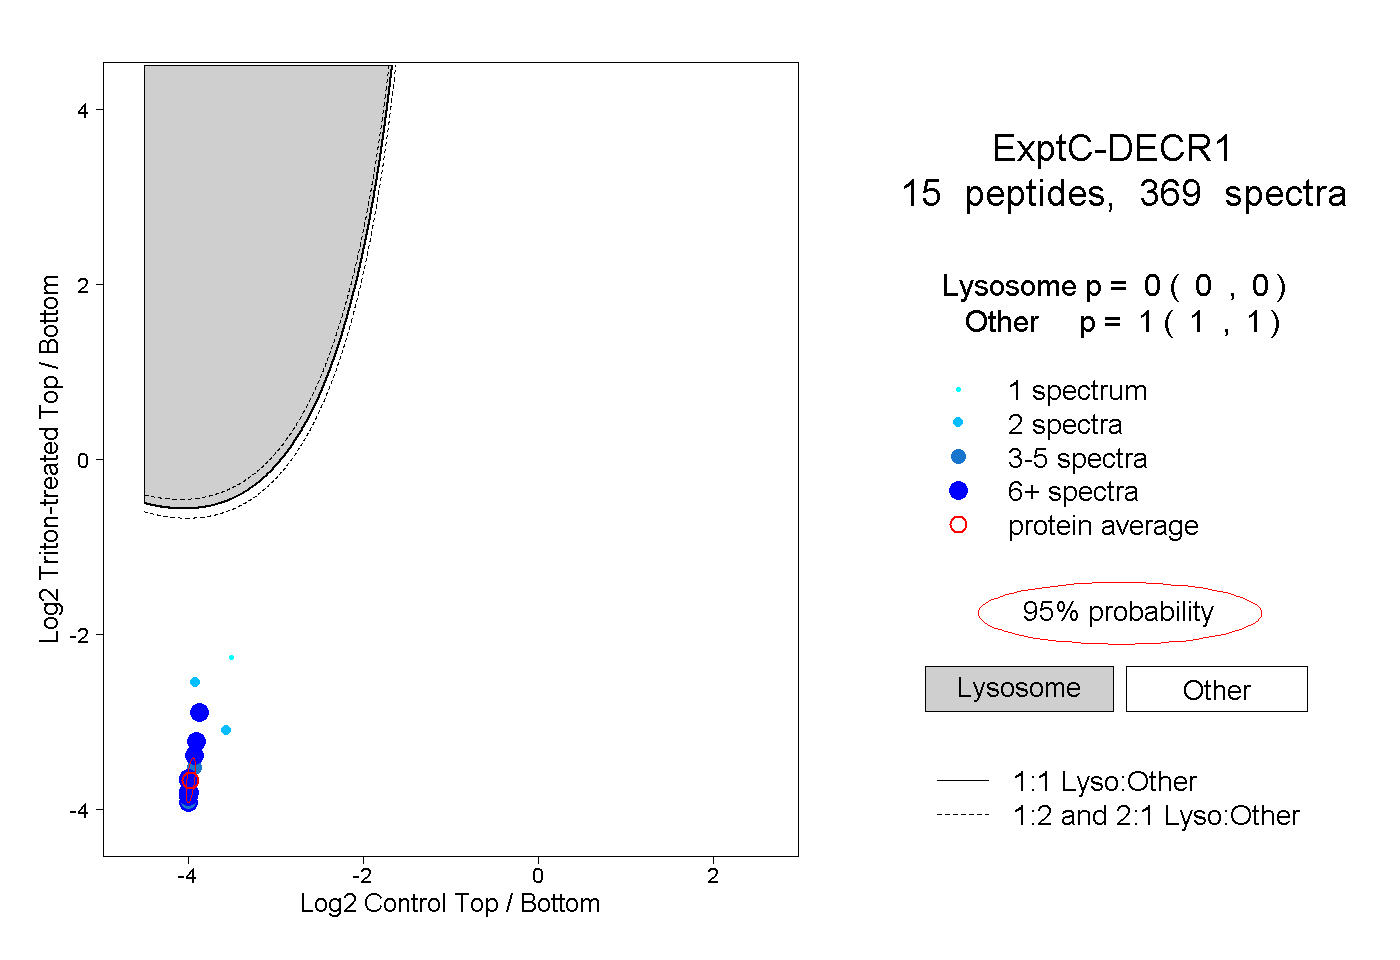
0.000 | 0.000
1.000 | 1.000
8peptides
spectra
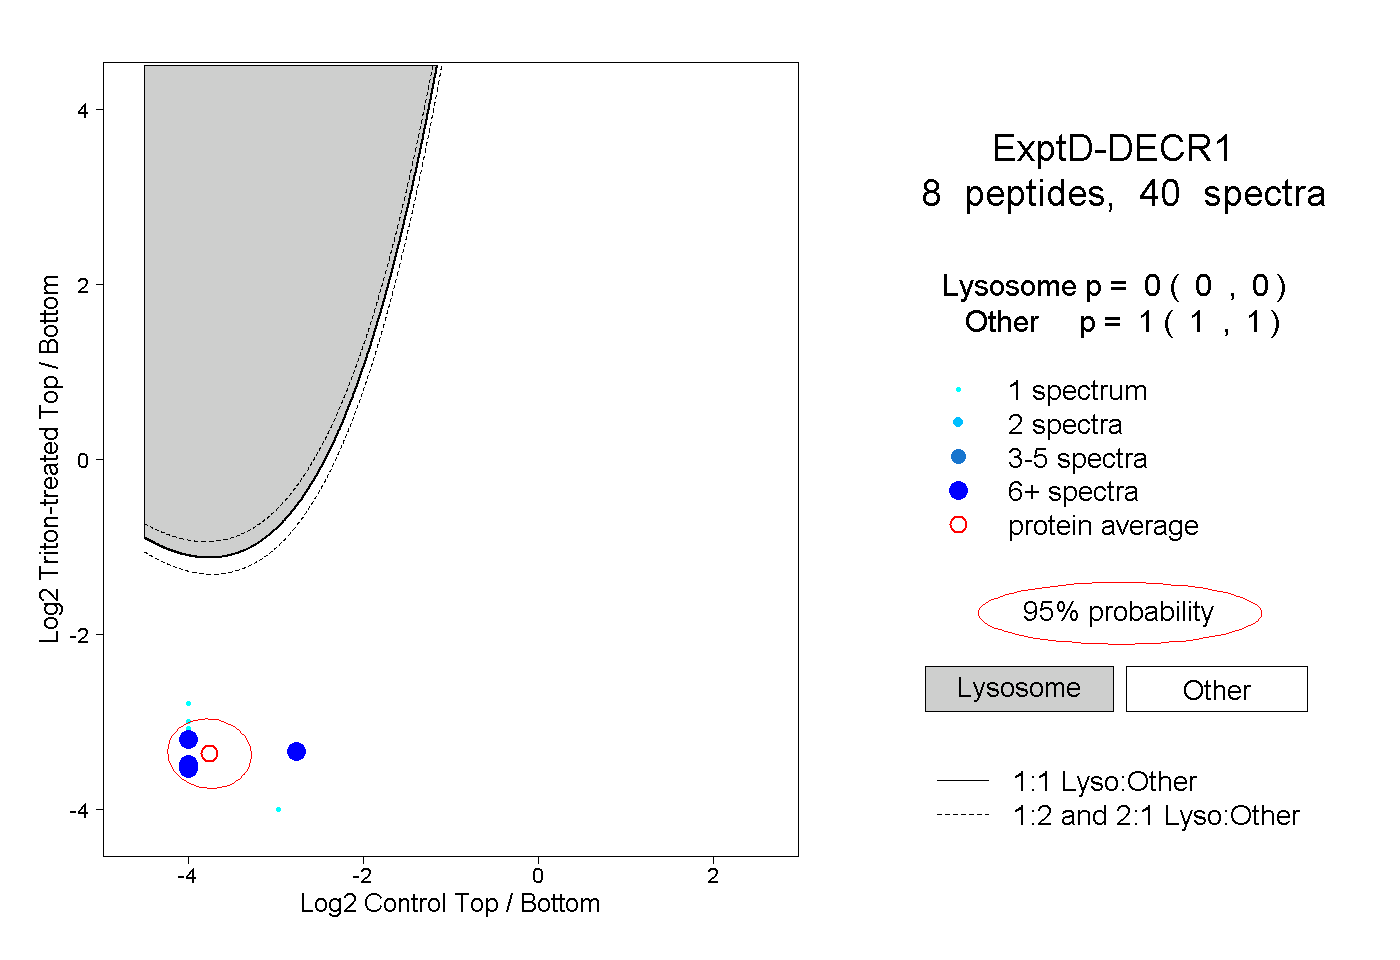
0.000 | 0.000
1.000 | 1.000