 13
13peptides
spectra
0.774 | 0.791
0.000 | 0.000
0.000 | 0.000
0.000 | 0.000
0.190 | 0.207
0.000 | 0.000
0.000 | 0.000
0.010 | 0.022
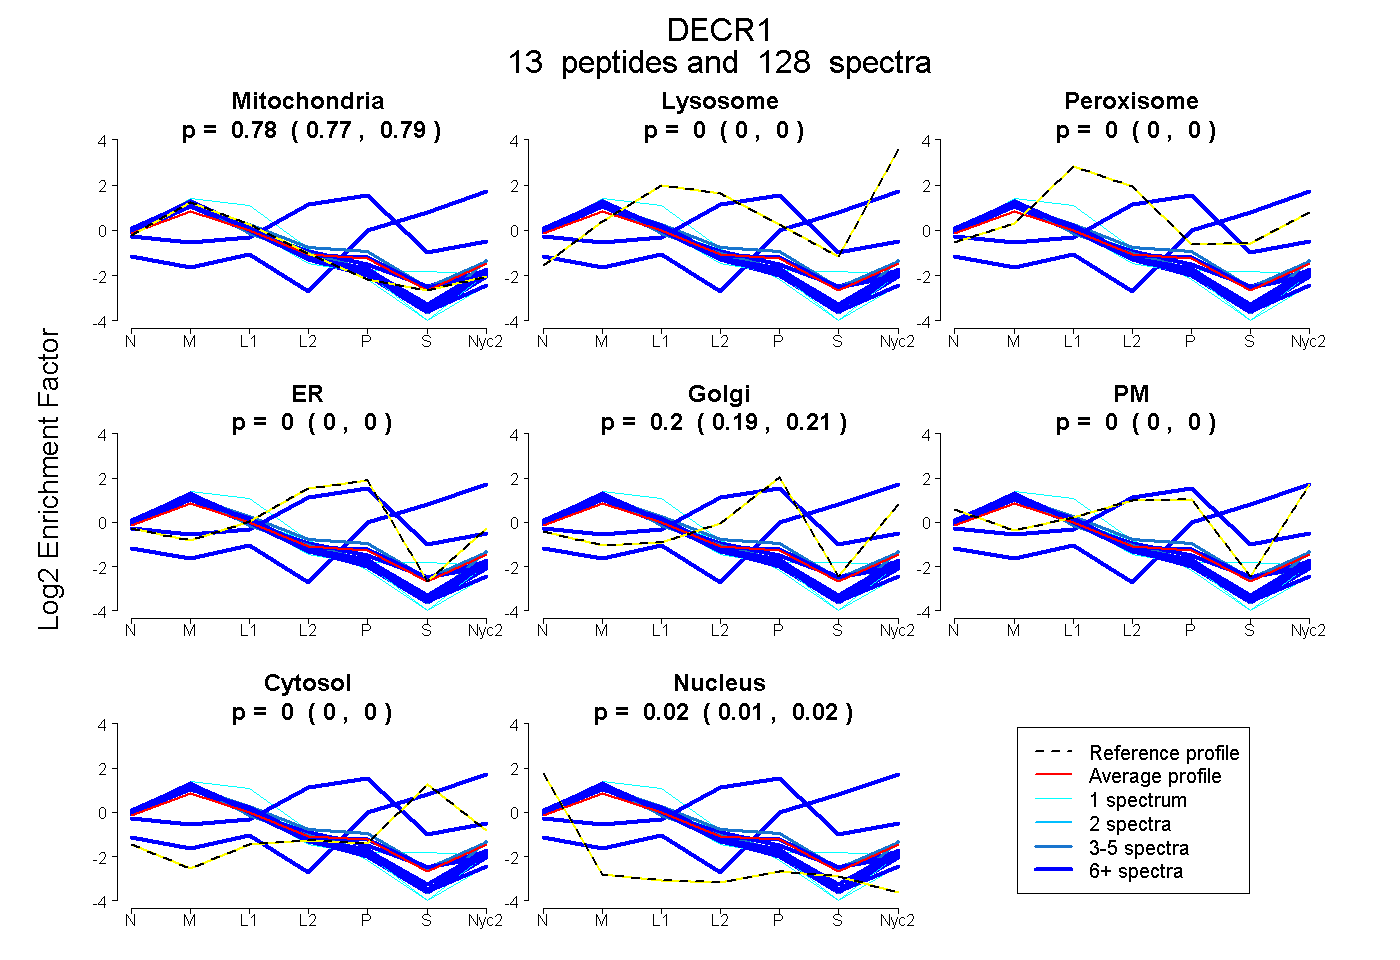
| Plot | Mito | Lyso | Perox | ER | Golgi | PM | Cytosol | Nucleus | |||||
| Expt A |
13 peptides |
128 spectra |
|
0.783 0.774 | 0.791 |
0.000 0.000 | 0.000 |
0.000 0.000 | 0.000 |
0.000 0.000 | 0.000 |
0.200 0.190 | 0.207 |
0.000 0.000 | 0.000 |
0.000 0.000 | 0.000 |
0.017 0.010 | 0.022 |
| 15 spectra, VAFITGGGTGLGK | 0.934 | 0.000 | 0.000 | 0.000 | 0.000 | 0.000 | 0.000 | 0.066 | ||
| 6 spectra, FNIIQPGPIK | 0.848 | 0.000 | 0.000 | 0.000 | 0.136 | 0.000 | 0.000 | 0.015 | ||
| 1 spectrum, NIDVLK | 0.937 | 0.000 | 0.000 | 0.000 | 0.019 | 0.000 | 0.000 | 0.045 | ||
| 13 spectra, SGVEAMNK | 0.908 | 0.000 | 0.000 | 0.000 | 0.064 | 0.000 | 0.000 | 0.028 | ||
| 1 spectrum, FDGGEEVFLSGEFNSLK | 0.851 | 0.000 | 0.036 | 0.017 | 0.000 | 0.000 | 0.096 | 0.000 | ||
| 1 spectrum, DPDMVHNTVLELIK | 1.000 | 0.000 | 0.000 | 0.000 | 0.000 | 0.000 | 0.000 | 0.000 | ||
| 25 spectra, ALLAR | 0.000 | 0.158 | 0.000 | 0.000 | 0.175 | 0.000 | 0.667 | 0.000 | ||
| 13 spectra, EEWDVIEGLIR | 0.945 | 0.000 | 0.000 | 0.000 | 0.000 | 0.009 | 0.000 | 0.046 | ||
| 13 spectra, VAGHPDVVINNAAGNFISPSER | 0.839 | 0.000 | 0.000 | 0.039 | 0.101 | 0.000 | 0.000 | 0.020 | ||
| 3 spectra, LDPTGK | 0.754 | 0.000 | 0.000 | 0.041 | 0.099 | 0.106 | 0.000 | 0.000 | ||
| 7 spectra, LLAR | 0.000 | 0.000 | 0.065 | 0.726 | 0.000 | 0.000 | 0.209 | 0.000 | ||
| 3 spectra, LSPNGWK | 0.847 | 0.000 | 0.000 | 0.000 | 0.004 | 0.126 | 0.000 | 0.023 | ||
| 27 spectra, SLAAEWGR | 0.907 | 0.000 | 0.000 | 0.000 | 0.064 | 0.012 | 0.000 | 0.016 |
| Plot | Mito | Lyso or Perox | ER | Golgi | PM | Cytosol | Nucleus | ||||||
| Expt B |
11 peptides |
34 spectra |
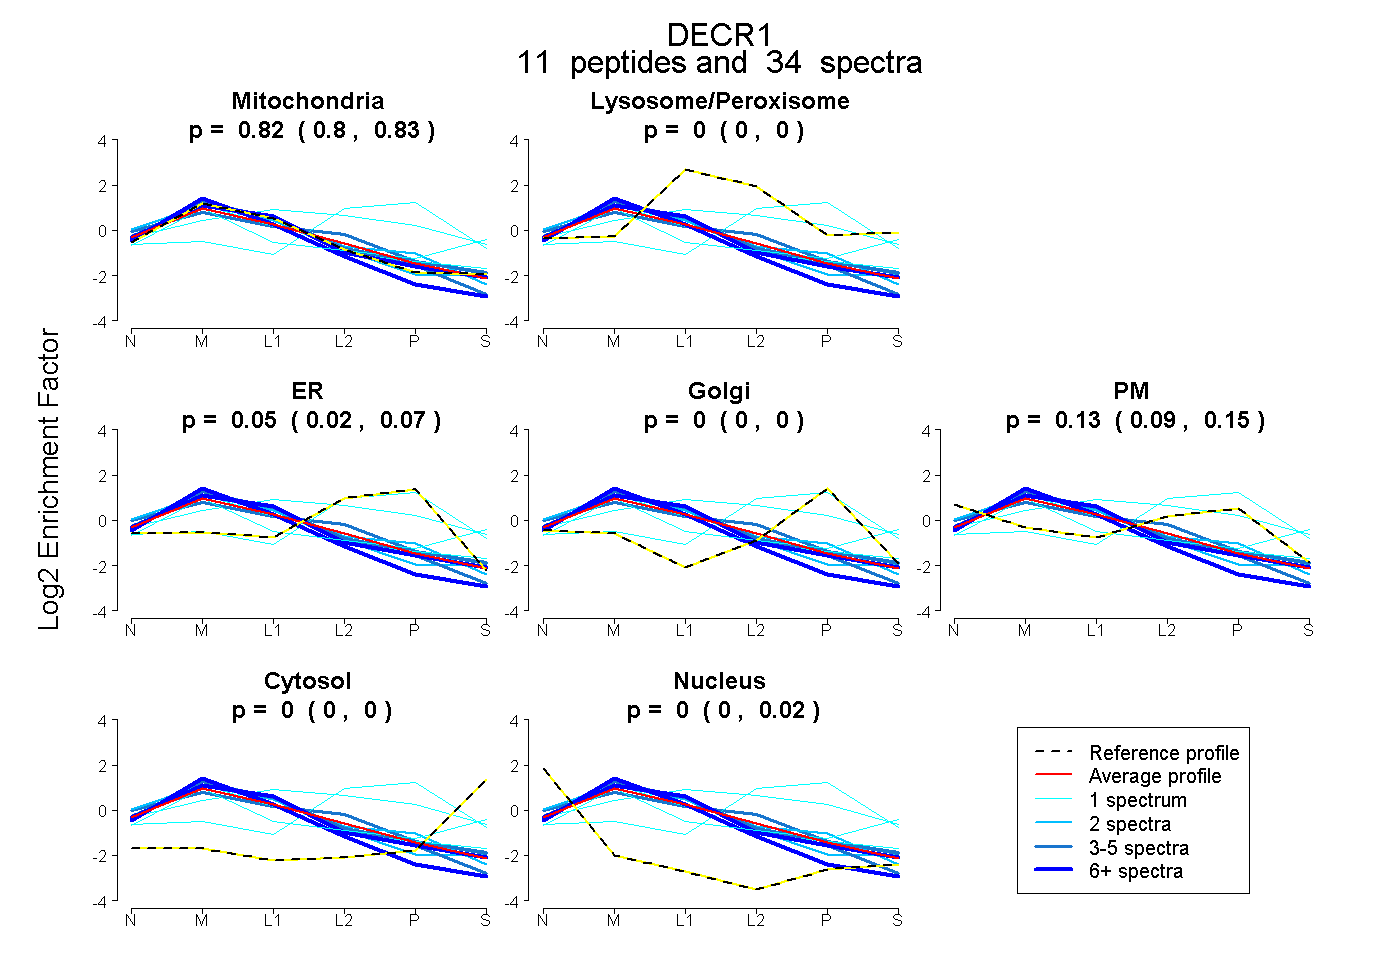 |
0.819 0.802 | 0.833 |
0.000 0.000 | 0.000 |
0.046 0.023 | 0.071 |
0.000 0.000 | 0.000 |
0.130 0.093 | 0.152 |
0.000 0.000 | 0.000 |
0.005 0.000 | 0.016 |
|||
| Plot | Lyso | Other | |||||||||||
| Expt C |
15 peptides |
369 spectra |
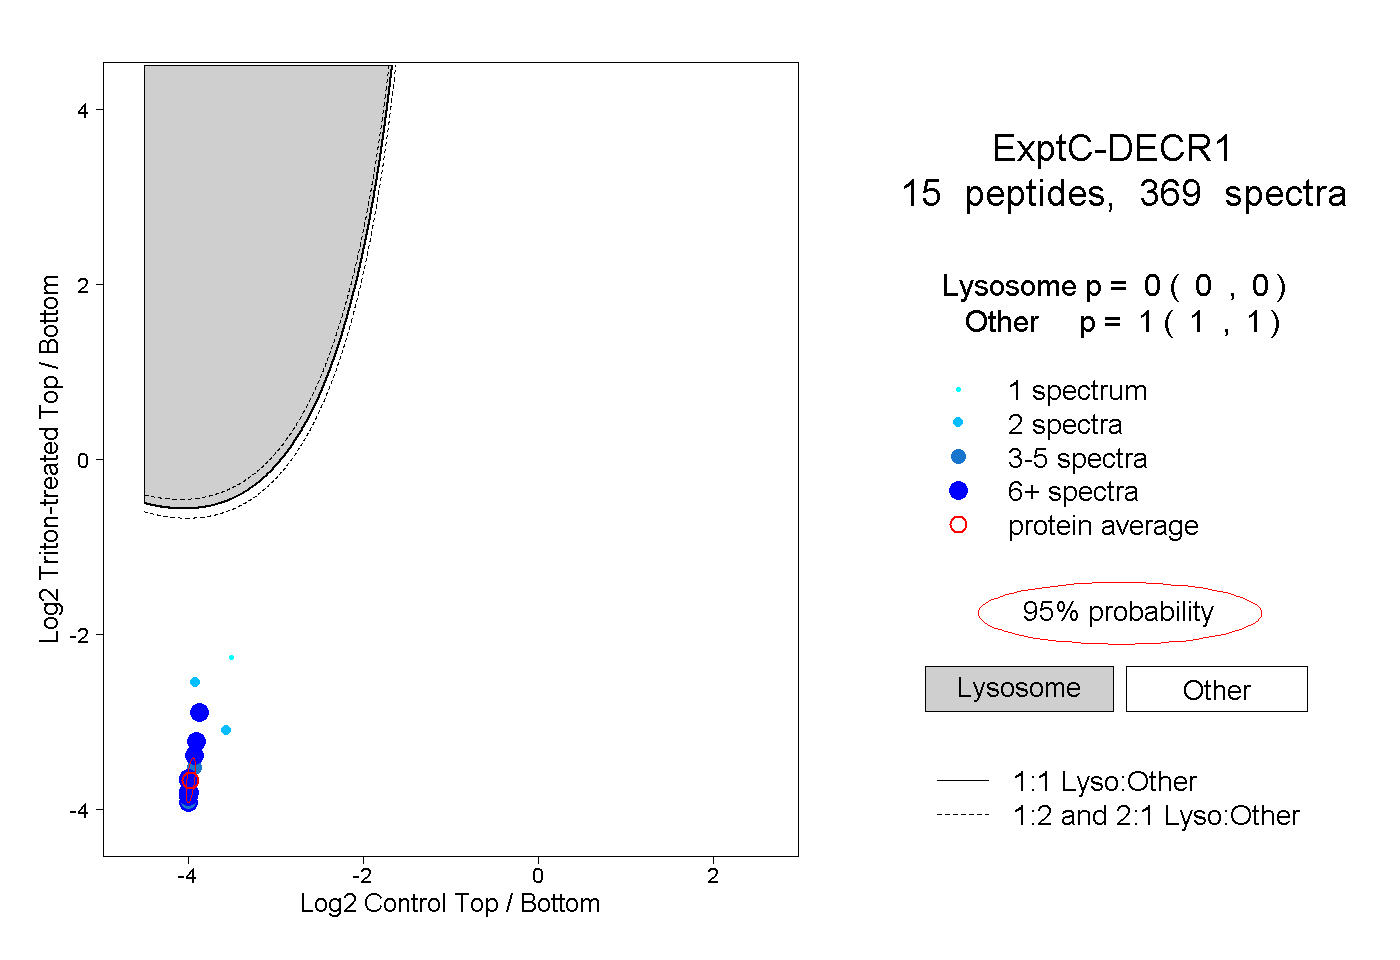 |
0.000 0.000 | 0.000 |
1.000 1.000 | 1.000 |
||||||||
| Plot | Lyso | Other | |||||||||||
| Expt D |
8 peptides |
40 spectra |
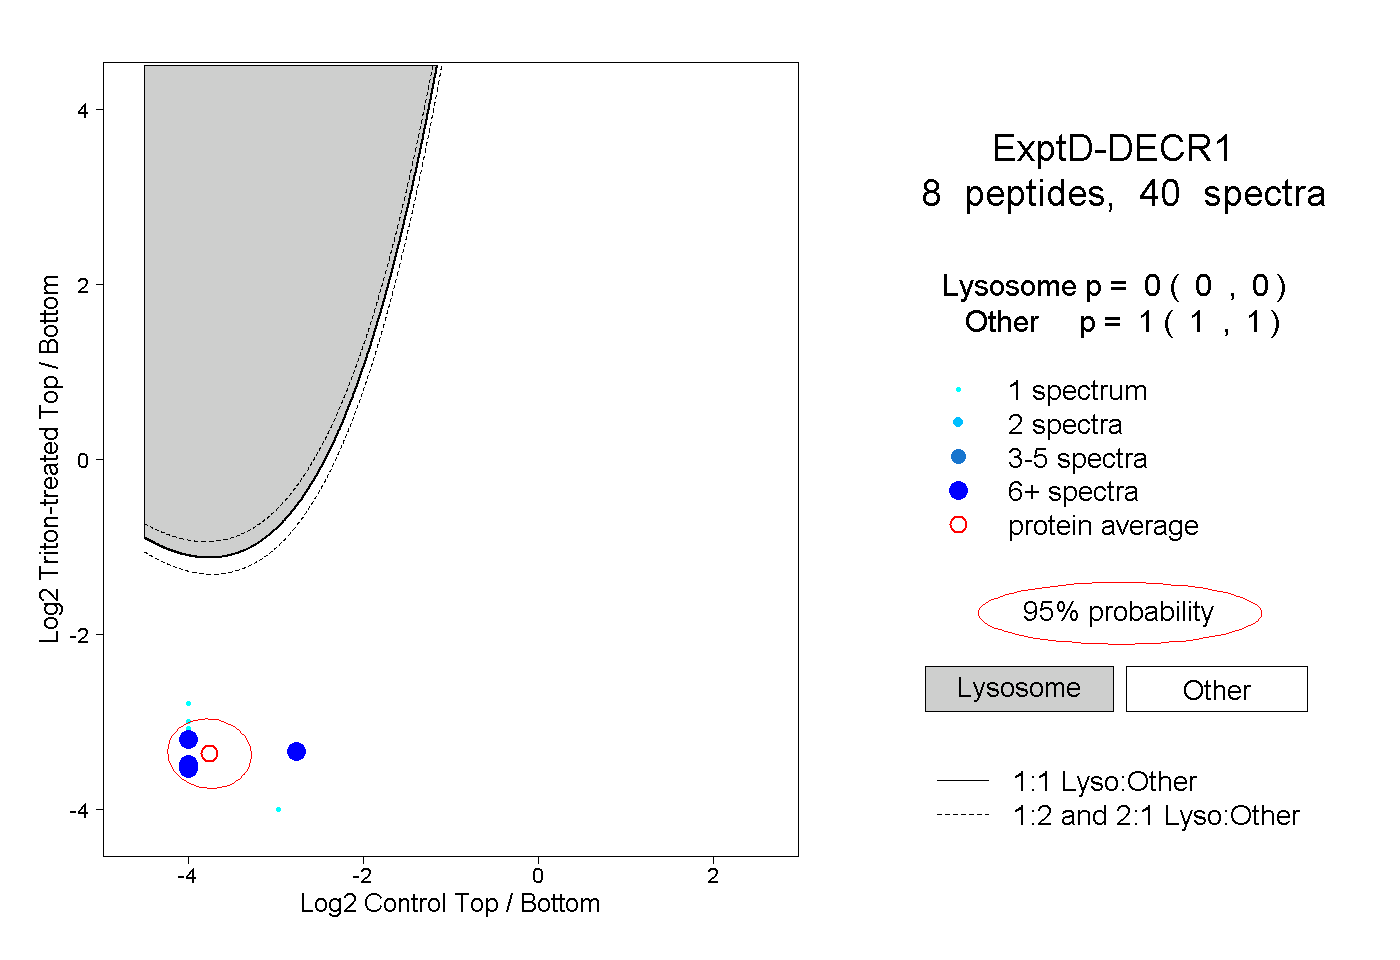 |
0.000 0.000 | 0.000 |
1.000 1.000 | 1.000 |