 5
5peptides
spectra
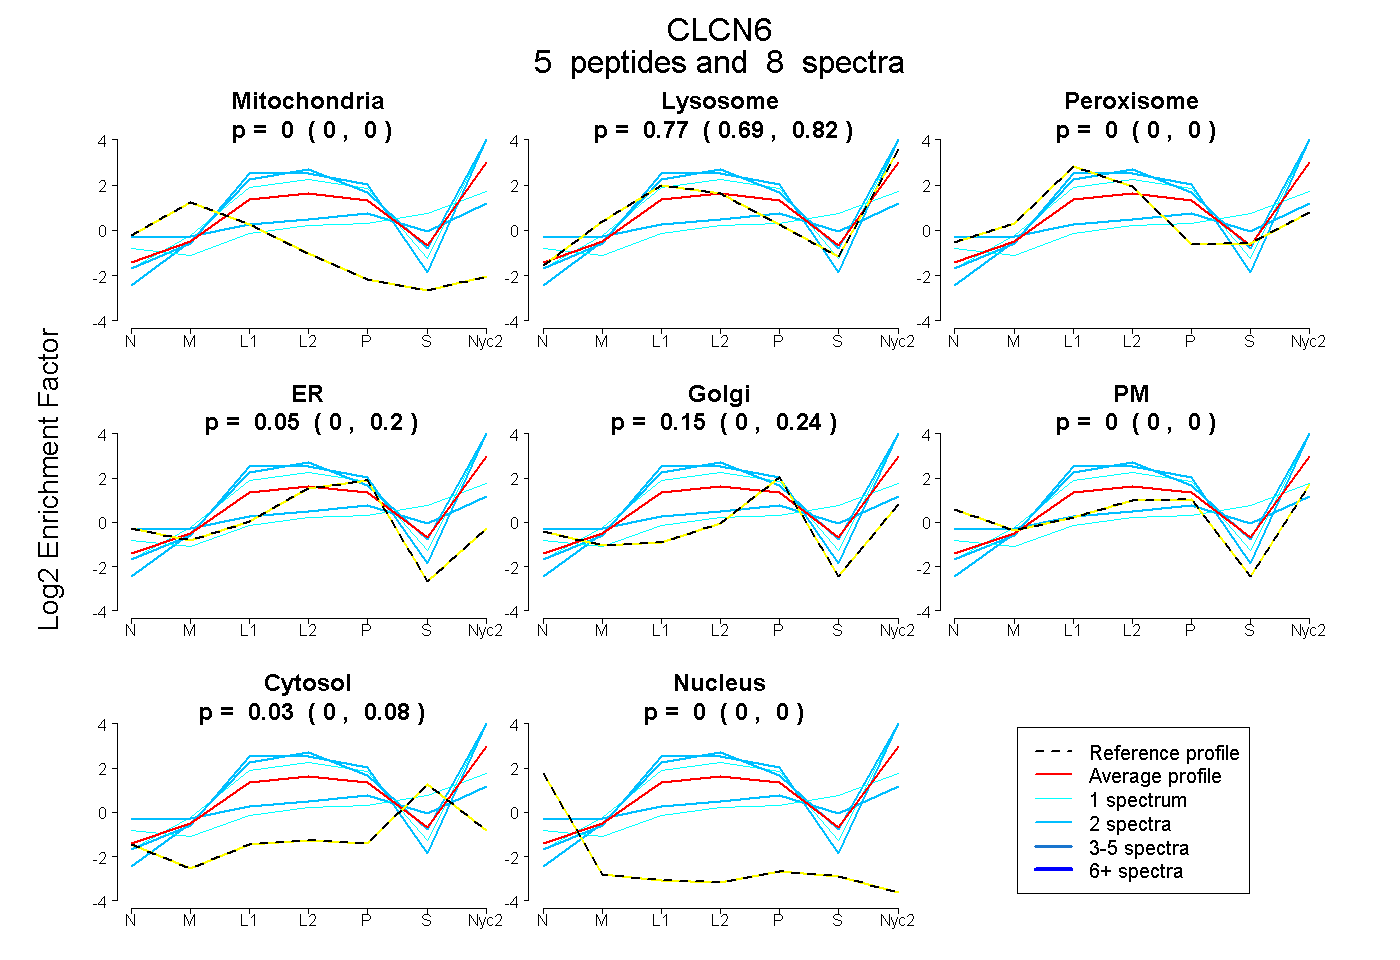
0.000 | 0.000
0.688 | 0.823
0.000 | 0.000
0.000 | 0.201
0.000 | 0.235
0.000 | 0.000
0.000 | 0.078
0.000 | 0.000
2peptides
spectra
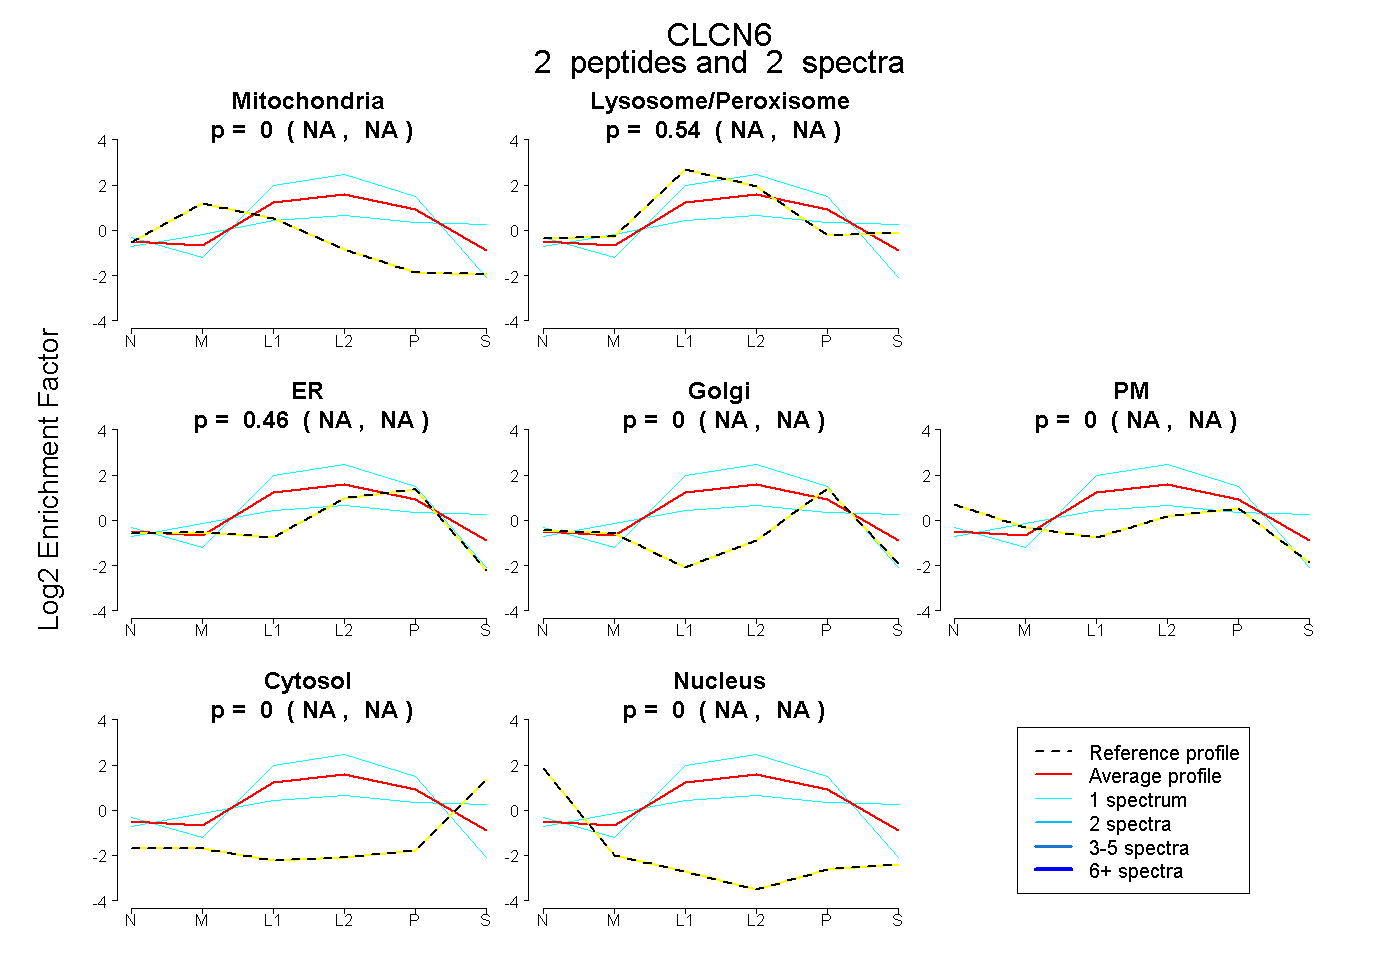
NA | NA
NA | NA
NA | NA
NA | NA
NA | NA
NA | NA
NA | NA
9peptides
spectra
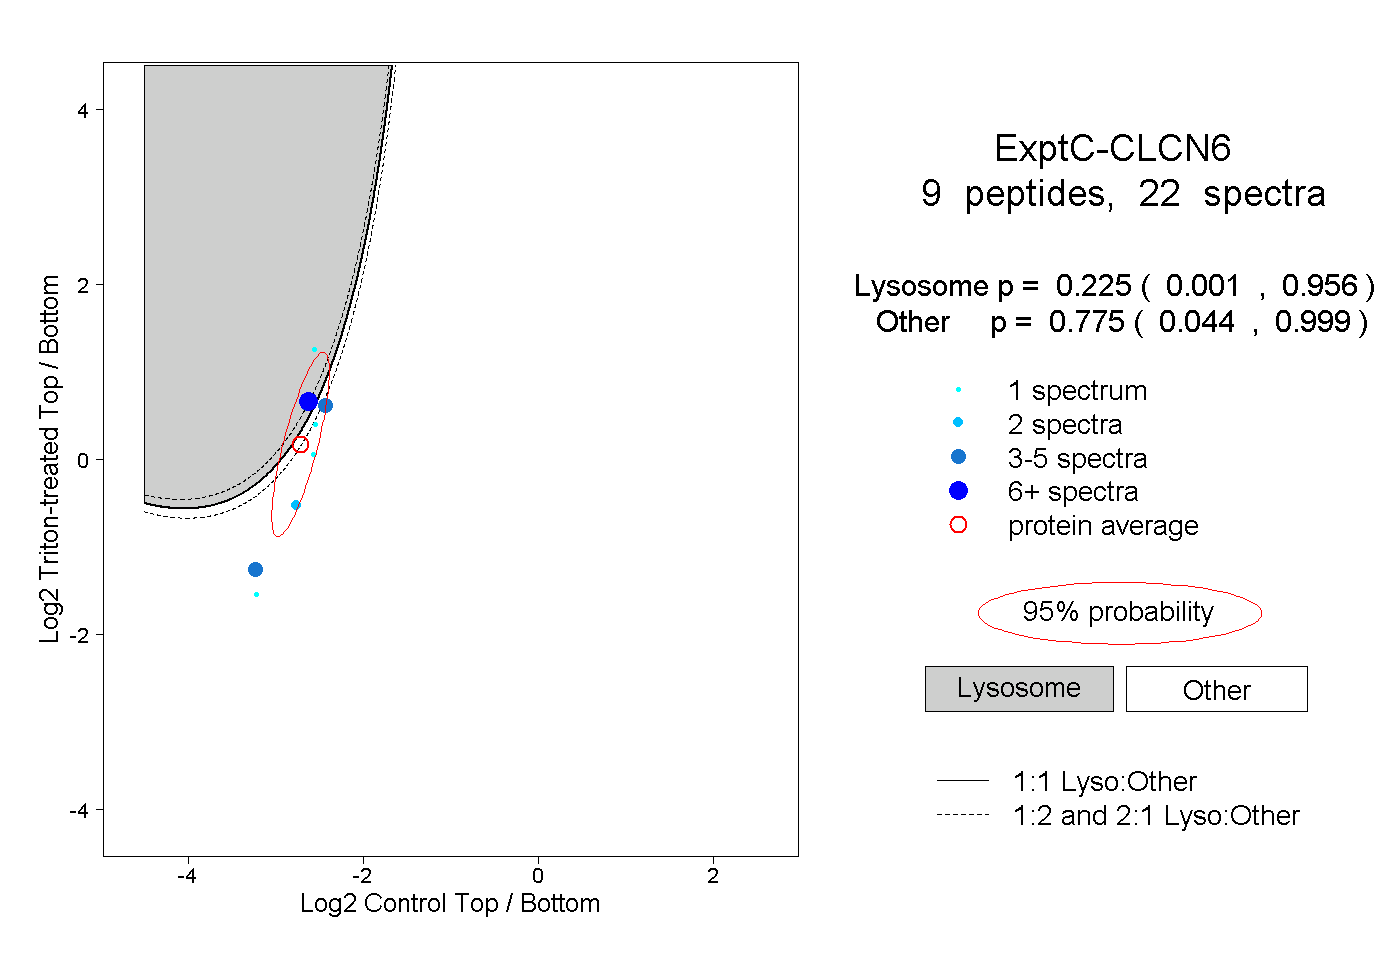
0.001 | 0.956
0.044 | 0.999