 5
5peptides
spectra
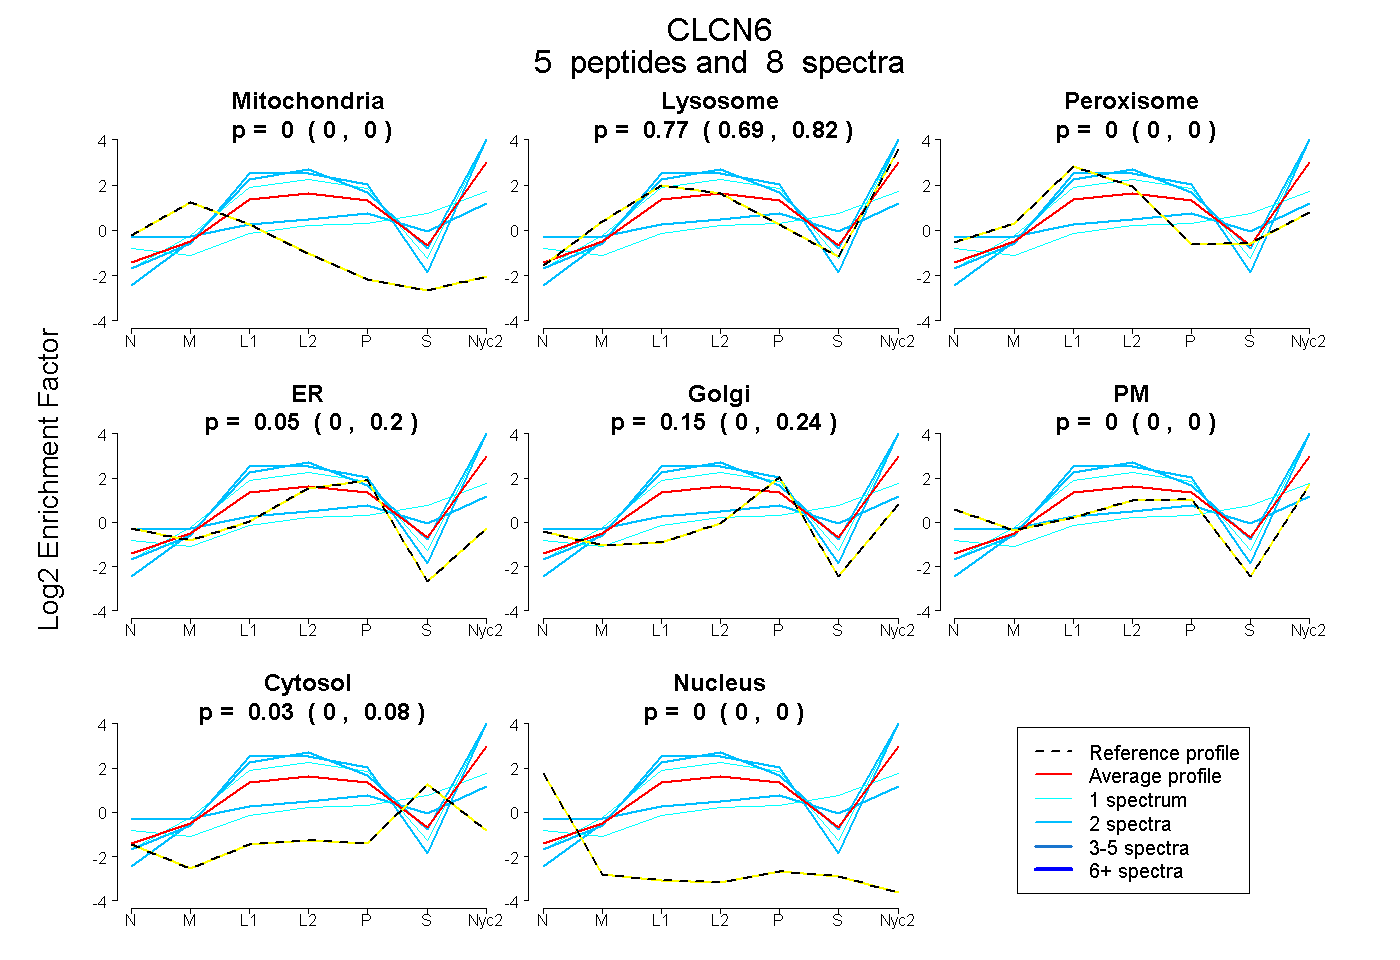
0.000 | 0.000
0.688 | 0.823
0.000 | 0.000
0.000 | 0.201
0.000 | 0.235
0.000 | 0.000
0.000 | 0.078
0.000 | 0.000
| Plot | Mito | Lyso | Perox | ER | Golgi | PM | Cytosol | Nucleus | |||||
| Expt A |
5 peptides |
8 spectra |
|
0.000 0.000 | 0.000 |
0.767 0.688 | 0.823 |
0.000 0.000 | 0.000 |
0.054 0.000 | 0.201 |
0.147 0.000 | 0.235 |
0.000 0.000 | 0.000 |
0.033 0.000 | 0.078 |
0.000 0.000 | 0.000 |
| 1 spectrum, TTVHHAFPVVTENR | 0.000 | 0.434 | 0.000 | 0.000 | 0.067 | 0.037 | 0.463 | 0.000 | ||
| 2 spectra, GNQLISNNIK | 0.000 | 0.202 | 0.176 | 0.000 | 0.191 | 0.180 | 0.251 | 0.000 | ||
| 1 spectrum, FPDIHDLDLTLLNPR | 0.000 | 0.931 | 0.000 | 0.057 | 0.012 | 0.000 | 0.000 | 0.000 | ||
| 2 spectra, SQLVTLLVR | 0.000 | 0.916 | 0.000 | 0.084 | 0.000 | 0.000 | 0.000 | 0.000 | ||
| 2 spectra, IQSLVSILR | 0.000 | 1.000 | 0.000 | 0.000 | 0.000 | 0.000 | 0.000 | 0.000 |
| Plot | Mito | Lyso or Perox | ER | Golgi | PM | Cytosol | Nucleus | ||||||
| Expt B |
2 peptides |
2 spectra |
 |
0.000 NA | NA |
0.543 NA | NA |
0.457 NA | NA |
0.000 NA | NA |
0.000 NA | NA |
0.000 NA | NA |
0.000 NA | NA |
|||
| Plot | Lyso | Other | |||||||||||
| Expt C |
9 peptides |
22 spectra |
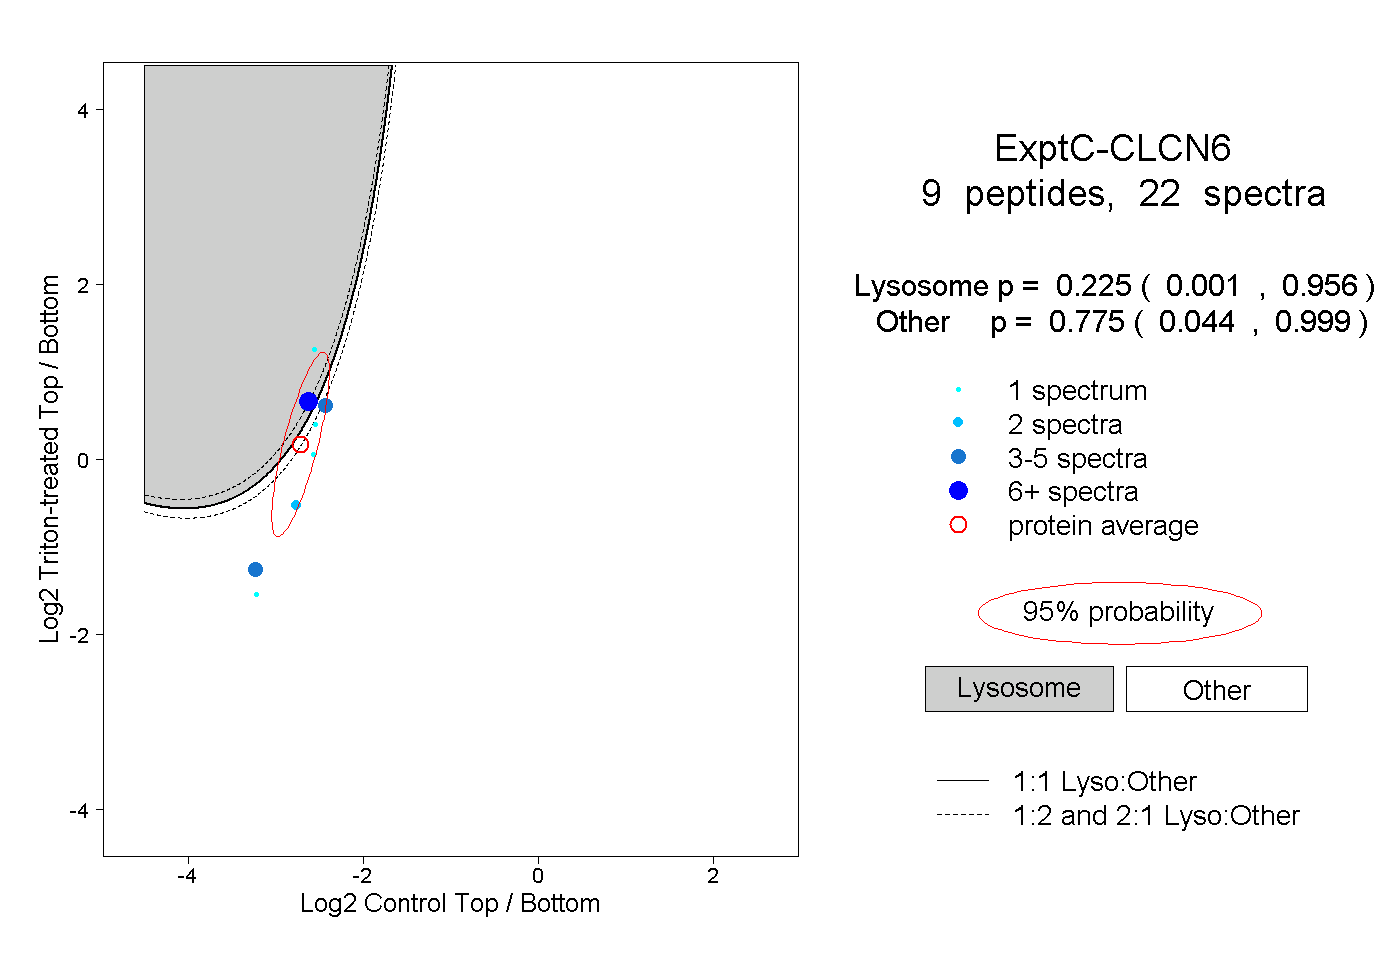 |
0.225 0.001 | 0.956 |
0.775 0.044 | 0.999 |