 7
7peptides
spectra
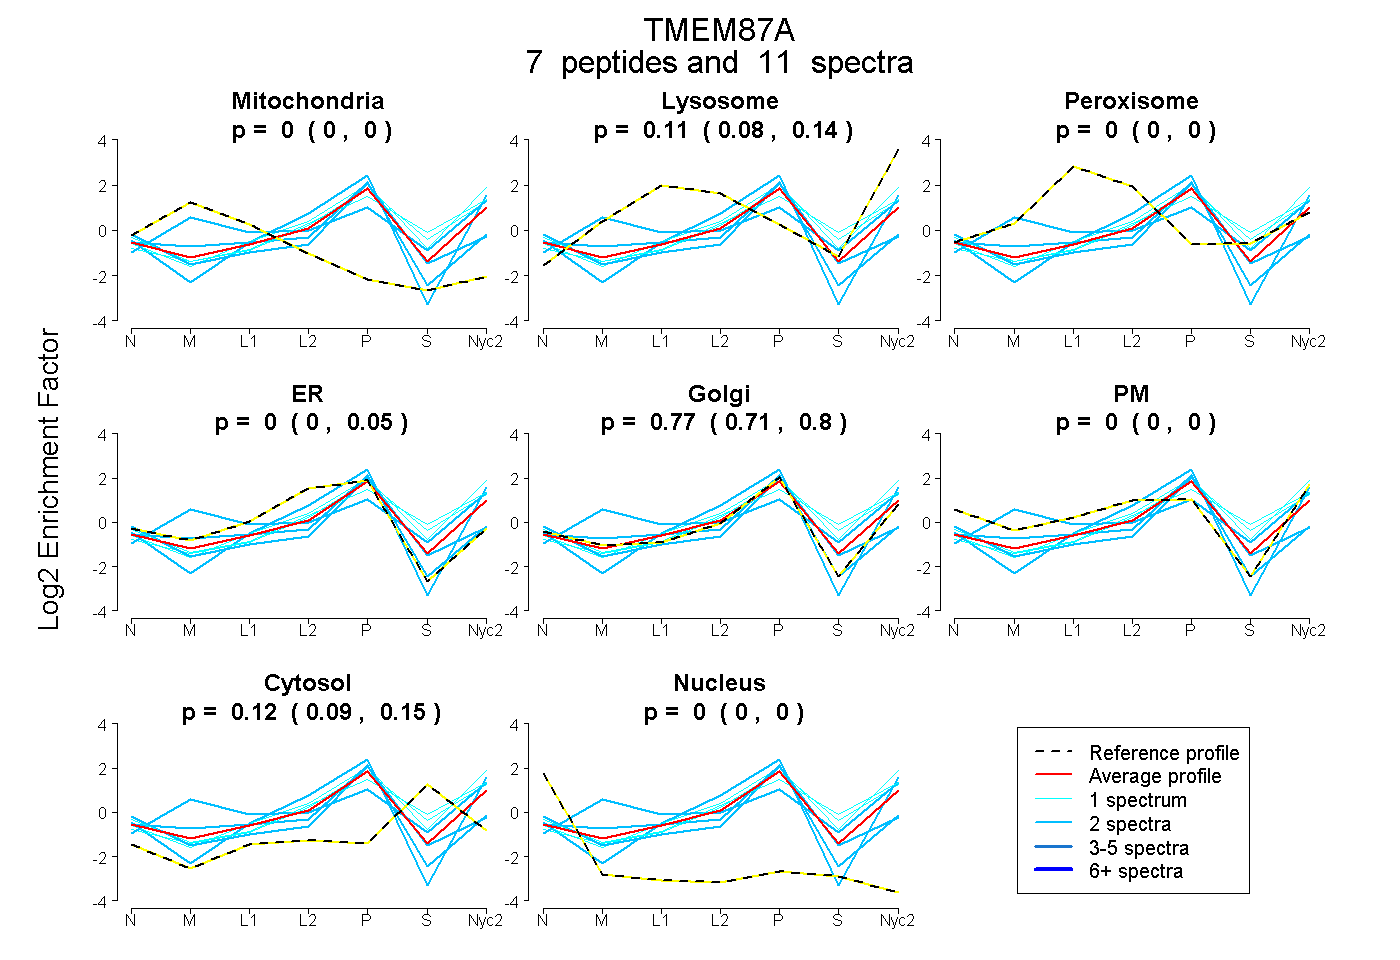
0.000 | 0.000
0.077 | 0.136
0.000 | 0.004
0.000 | 0.045
0.709 | 0.797
0.000 | 0.000
0.087 | 0.148
0.000 | 0.000
8peptides
spectra
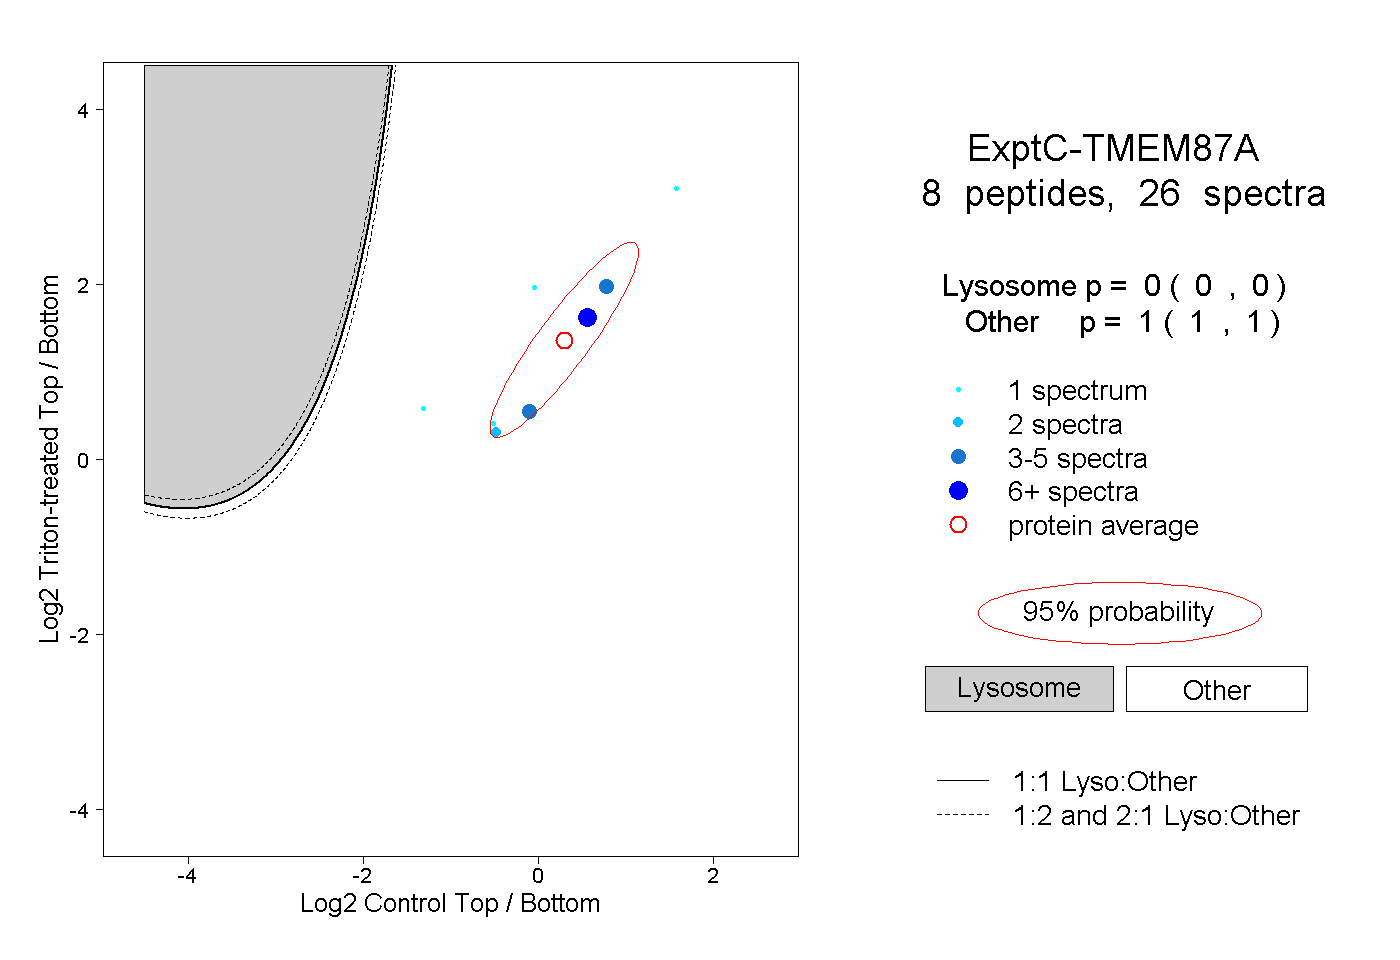
0.000 | 0.000
1.000 | 1.000
2peptides
spectra
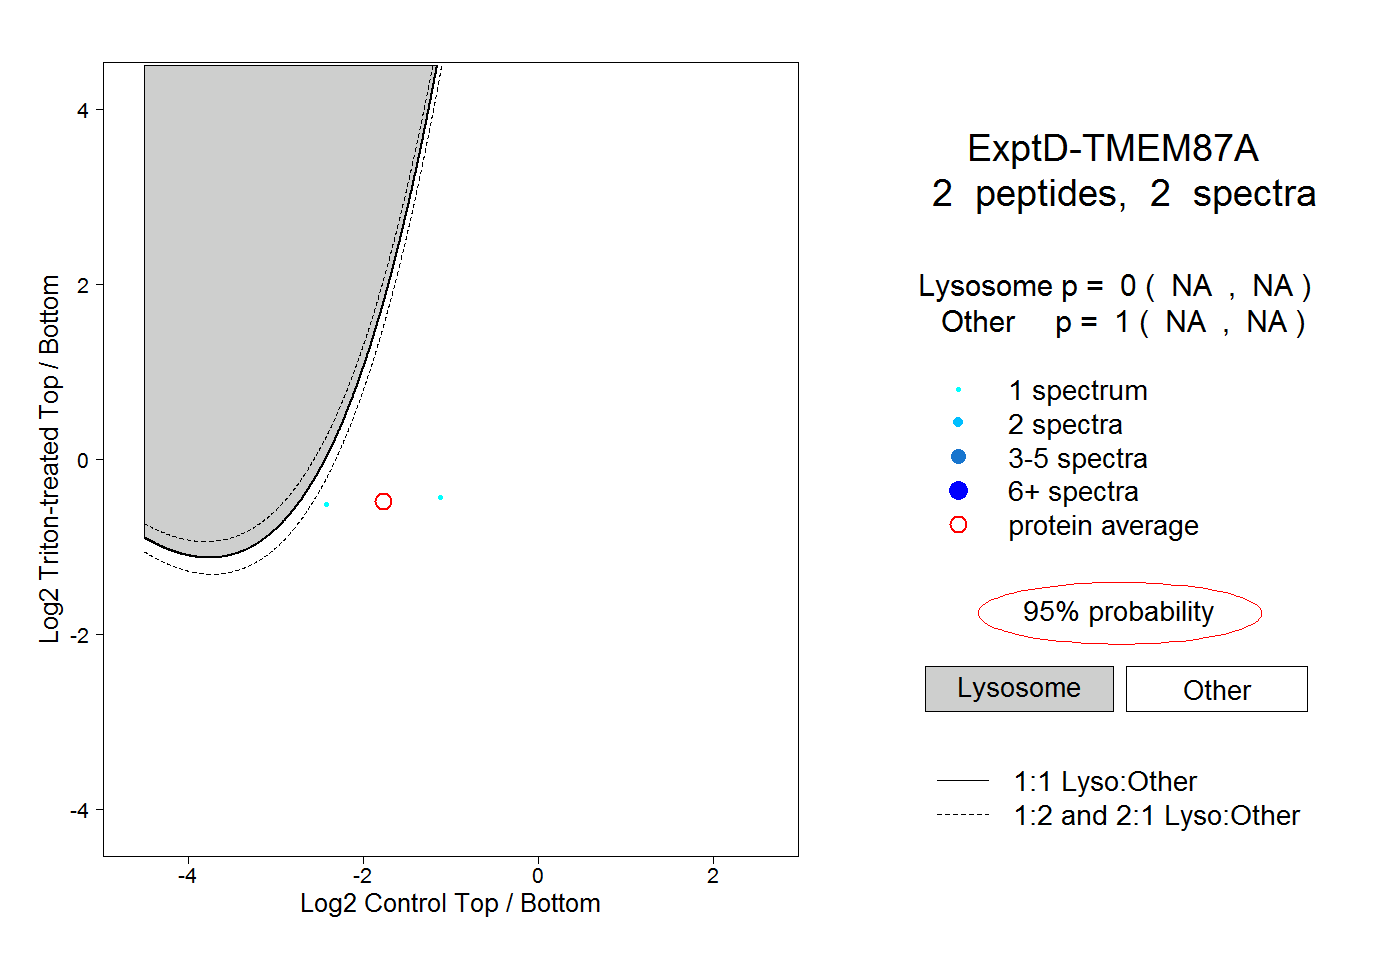
NA | NA
NA | NA