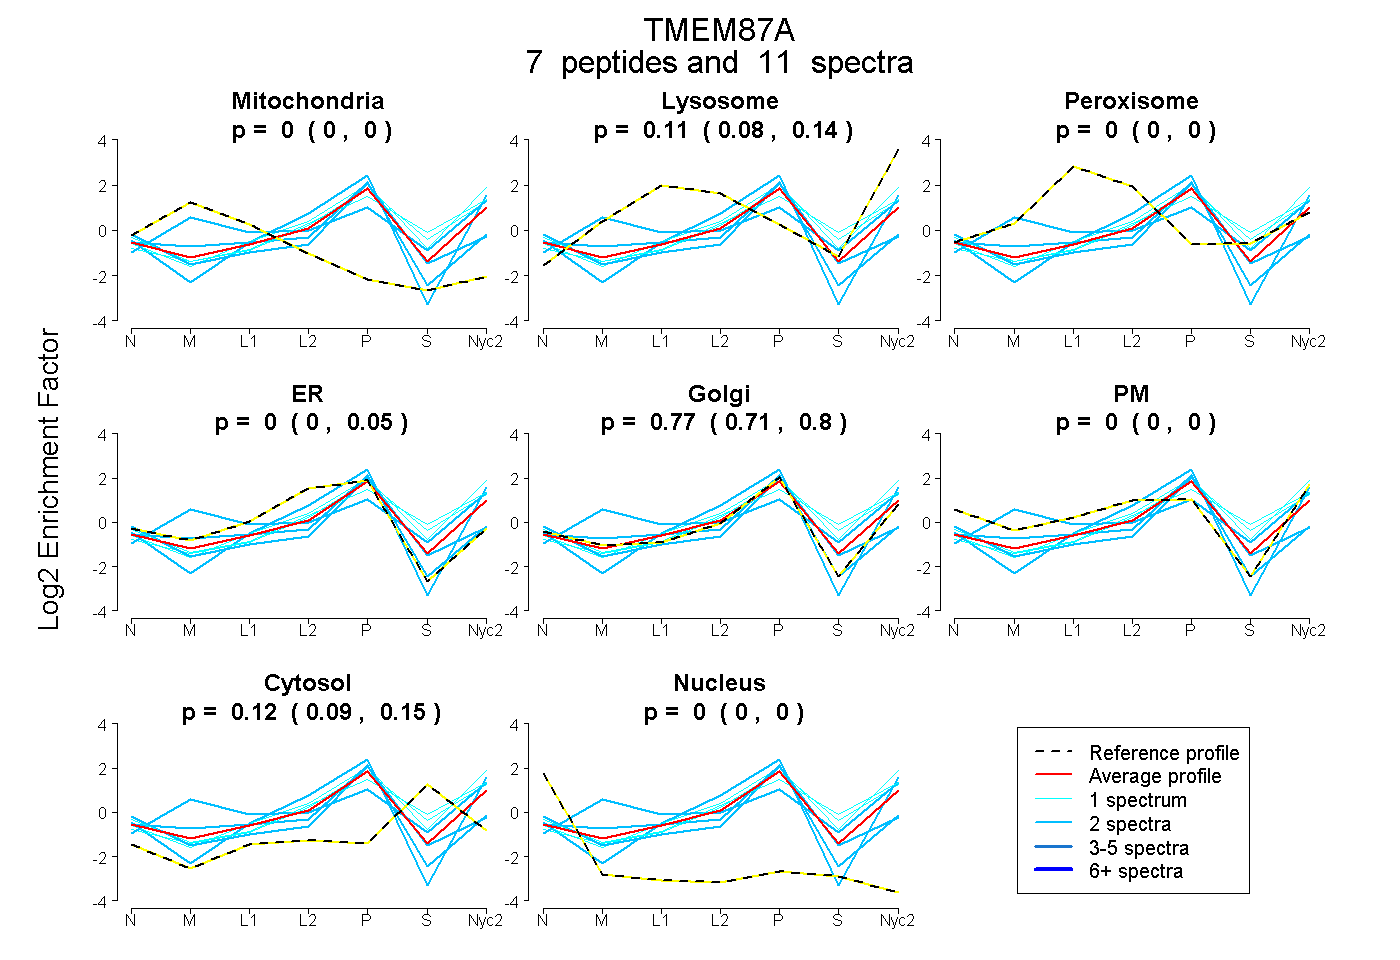
 7
7peptides
spectra
0.000 | 0.000
0.077 | 0.136
0.000 | 0.004
0.000 | 0.045
0.709 | 0.797
0.000 | 0.000
0.087 | 0.148
0.000 | 0.000
| Plot | Mito | Lyso | Perox | ER | Golgi | PM | Cytosol | Nucleus | |||||
| Expt A |
7 peptides |
11 spectra |
|
0.000 0.000 | 0.000 |
0.112 0.077 | 0.136 |
0.000 0.000 | 0.004 |
0.000 0.000 | 0.045 |
0.768 0.709 | 0.797 |
0.000 0.000 | 0.000 |
0.120 0.087 | 0.148 |
0.000 0.000 | 0.000 |
| 2 spectra, ESFEGMK | 0.082 | 0.000 | 0.000 | 0.147 | 0.756 | 0.000 | 0.000 | 0.016 | ||
| 2 spectra, MITHFER | 0.000 | 0.000 | 0.000 | 0.027 | 0.768 | 0.000 | 0.150 | 0.055 | ||
| 2 spectra, SYFNFGK | 0.111 | 0.370 | 0.000 | 0.000 | 0.409 | 0.000 | 0.110 | 0.000 | ||
| 1 spectrum, LPLLGEK | 0.000 | 0.157 | 0.000 | 0.000 | 0.611 | 0.000 | 0.232 | 0.000 | ||
| 1 spectrum, AVFYAEFQNIR | 0.000 | 0.237 | 0.000 | 0.000 | 0.637 | 0.000 | 0.127 | 0.000 | ||
| 2 spectra, ADEVETYLENLK | 0.000 | 0.000 | 0.000 | 0.107 | 0.809 | 0.084 | 0.000 | 0.000 | ||
| 1 spectrum, YQTSSK | 0.000 | 0.181 | 0.000 | 0.000 | 0.501 | 0.038 | 0.280 | 0.000 |
| Plot | Lyso | Other | |||||||||||
| Expt C |
8 peptides |
26 spectra |
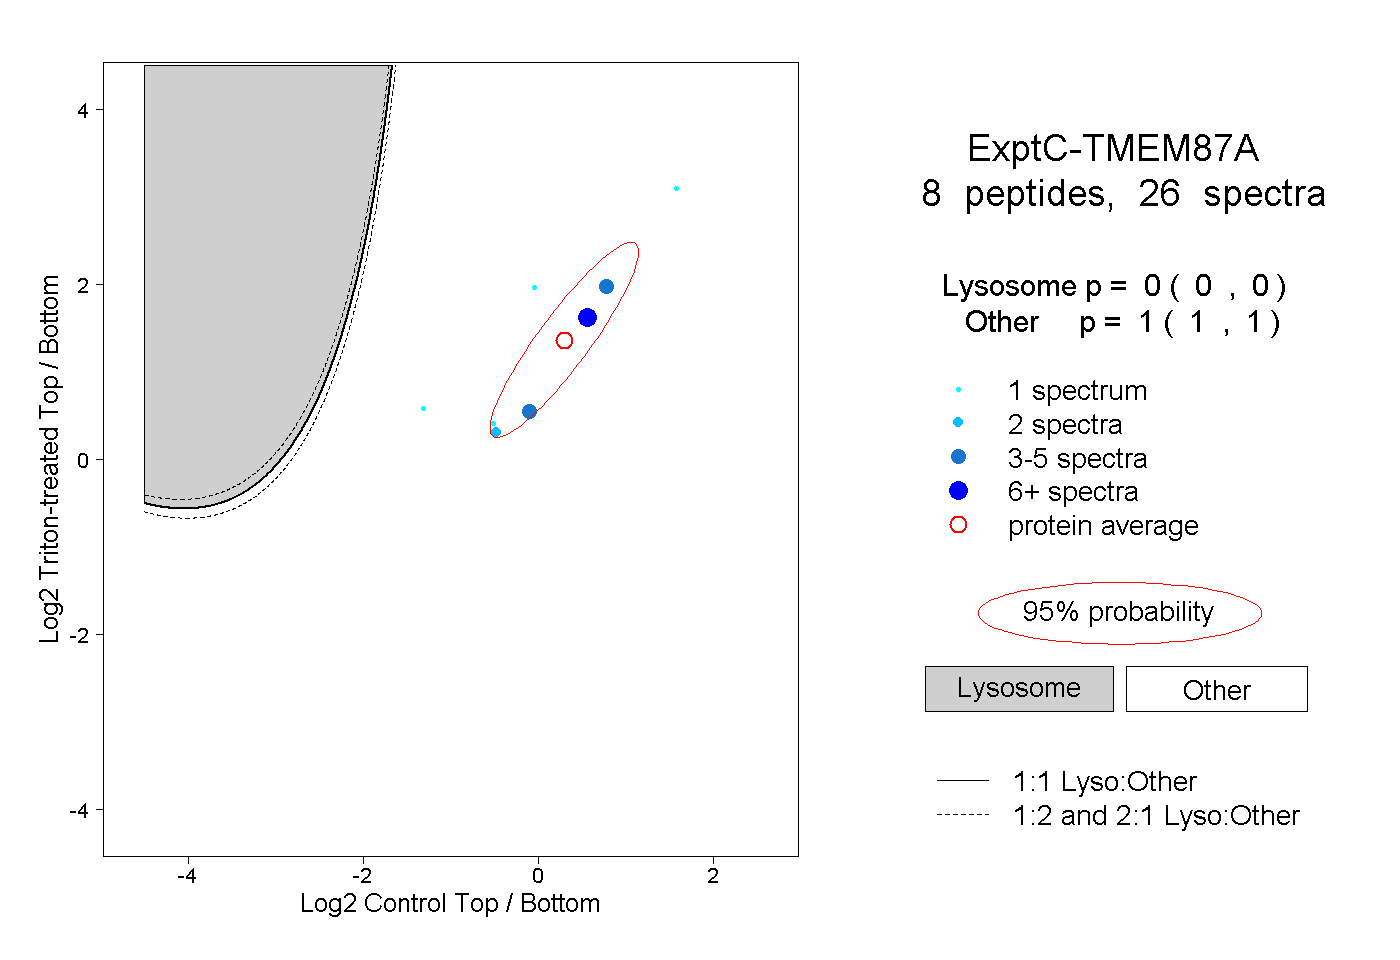 |
0.000 0.000 | 0.000 |
1.000 1.000 | 1.000 |
||||||||
| Plot | Lyso | Other | |||||||||||
| Expt D |
2 peptides |
2 spectra |
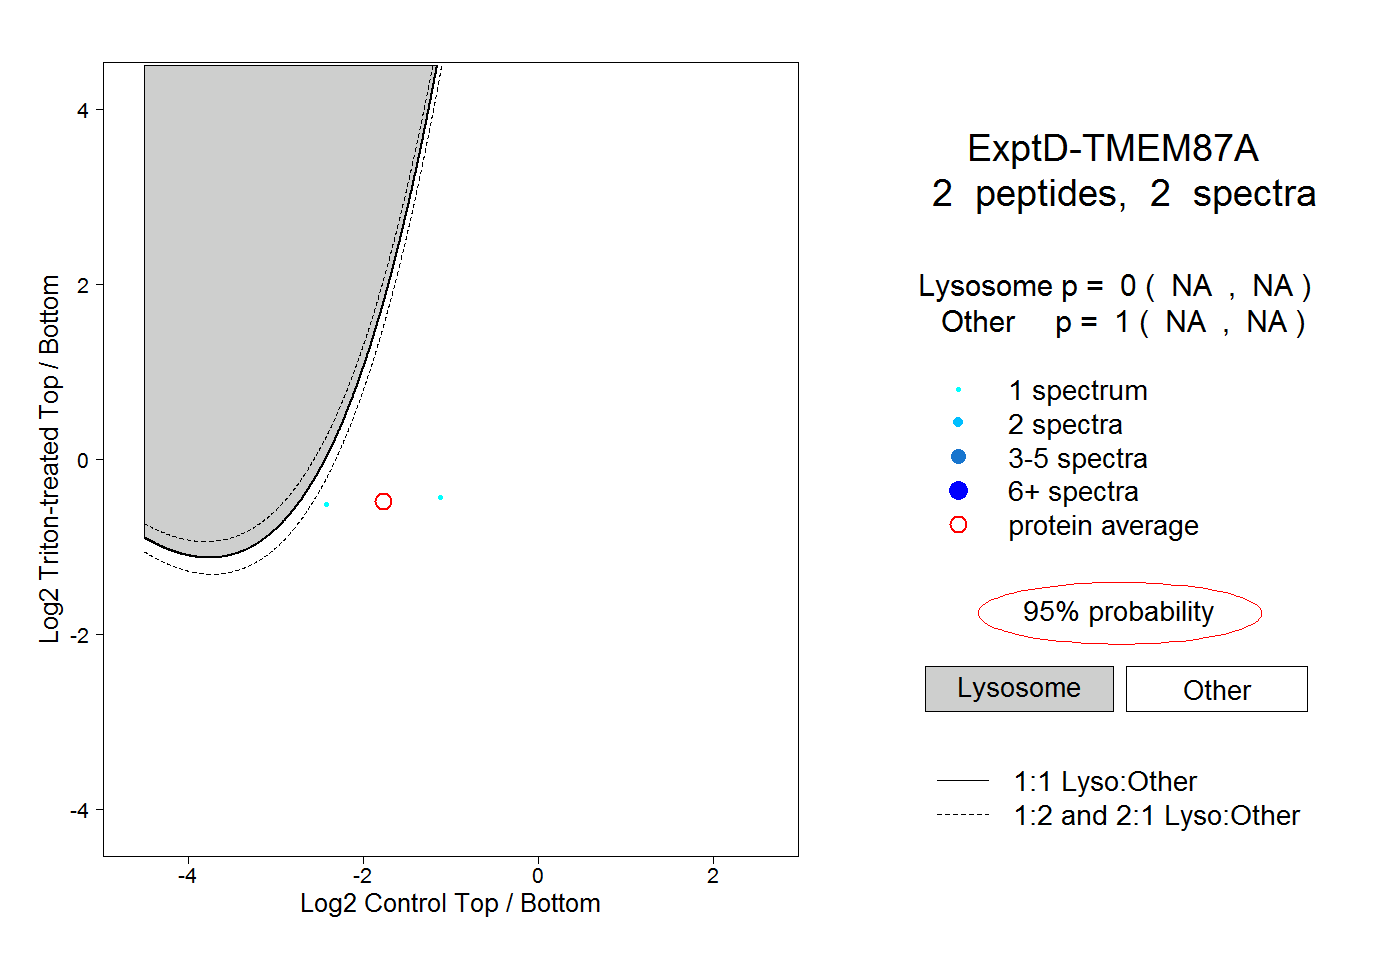 |
0.000 NA | NA |
1.000 NA | NA |