 2
2peptides
spectra
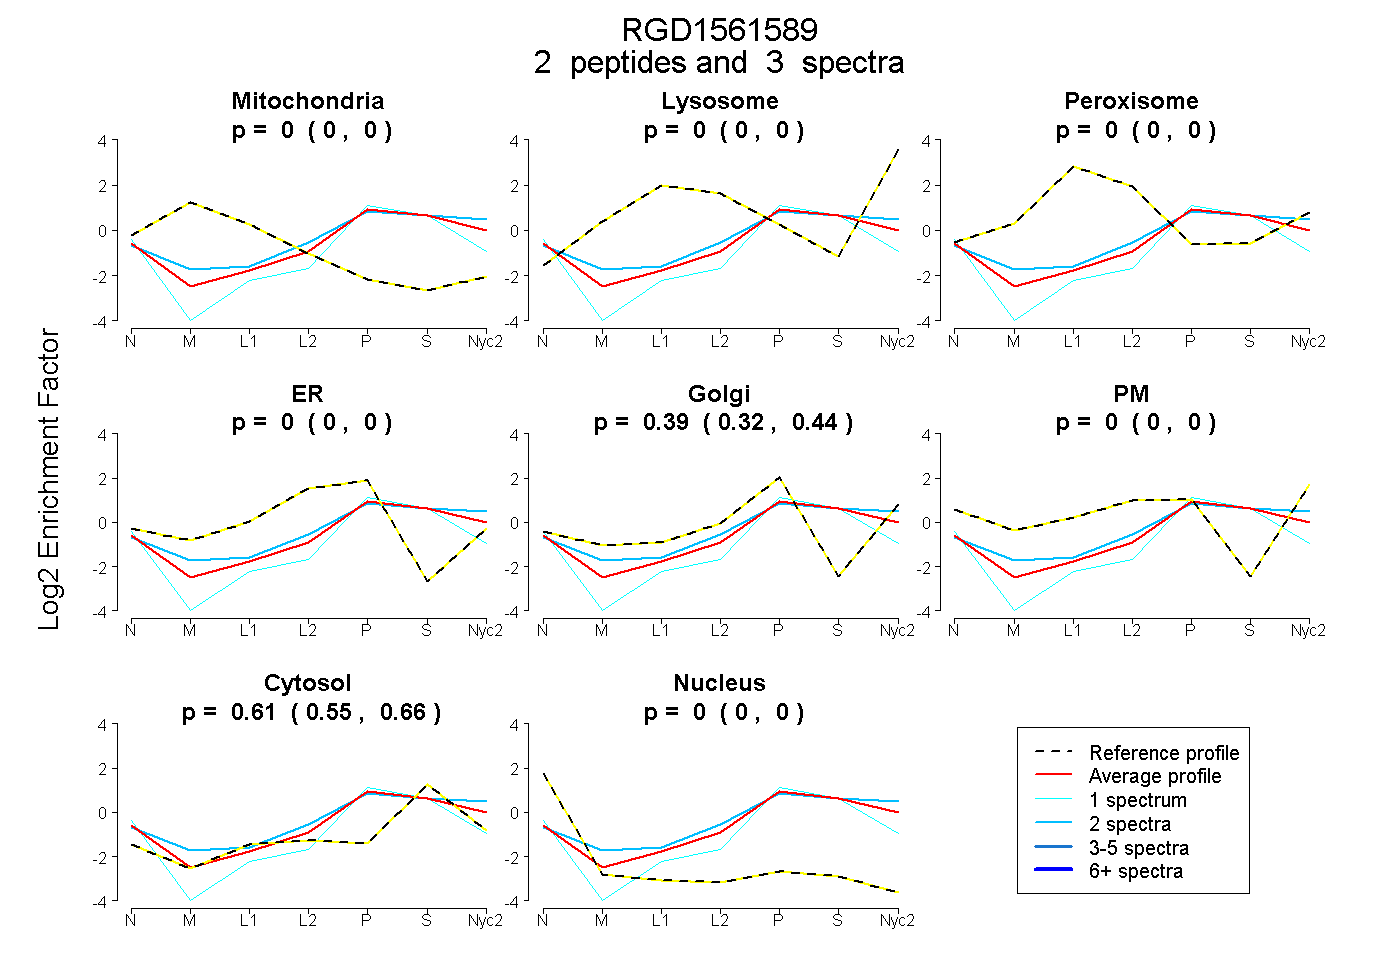
0.000 | 0.000
0.000 | 0.000
0.000 | 0.000
0.000 | 0.000
0.325 | 0.440
0.000 | 0.000
0.549 | 0.659
0.000 | 0.000
1peptide
spectra
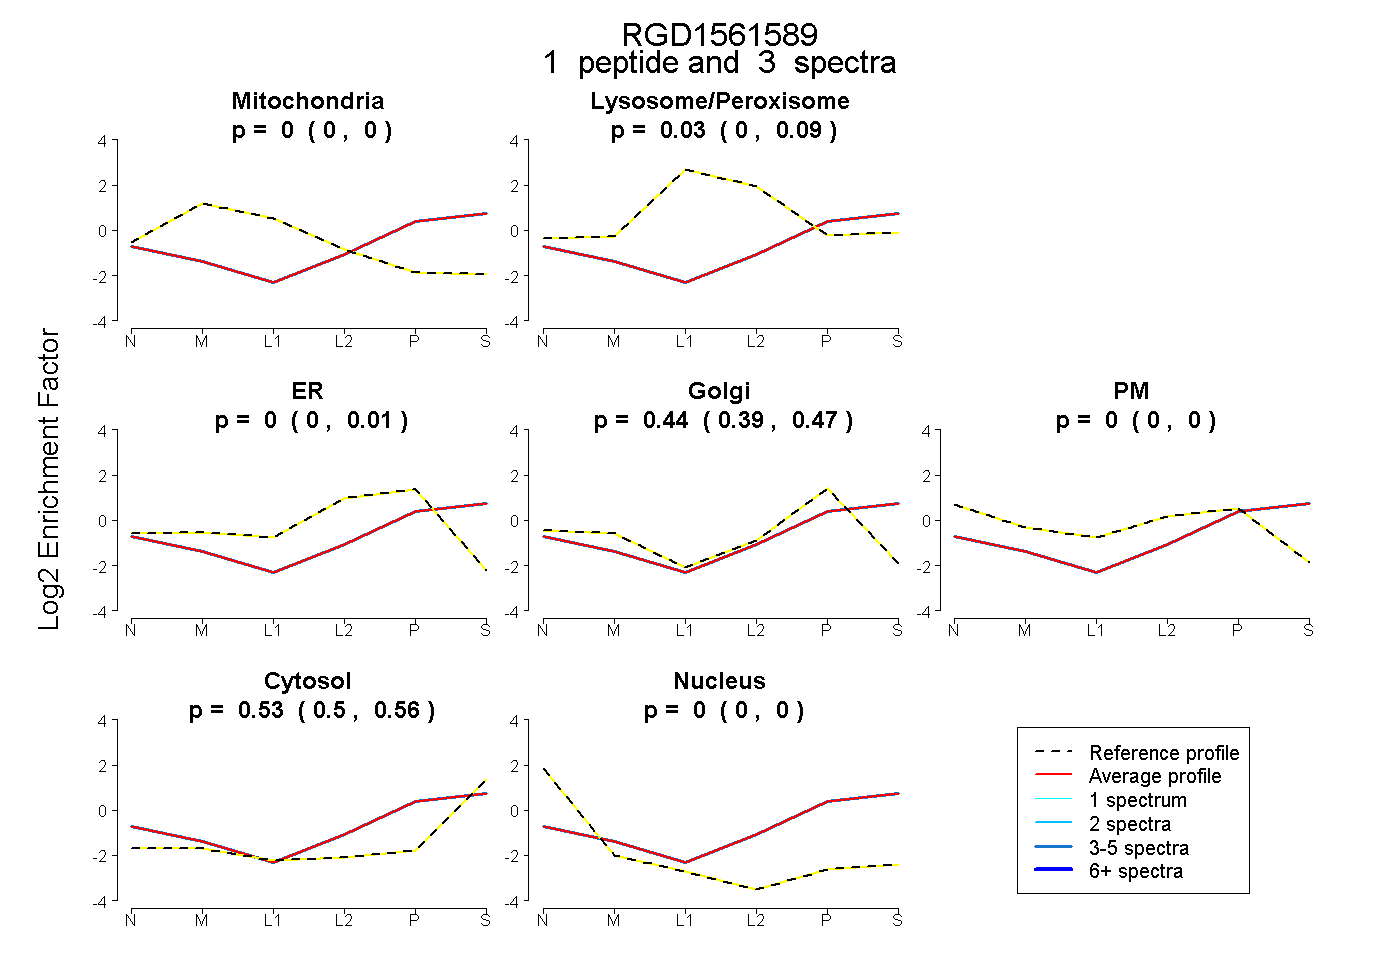
0.000 | 0.000
0.000 | 0.086
0.000 | 0.014
0.385 | 0.472
0.000 | 0.000
0.499 | 0.557
0.000 | 0.000
1peptide
spectra
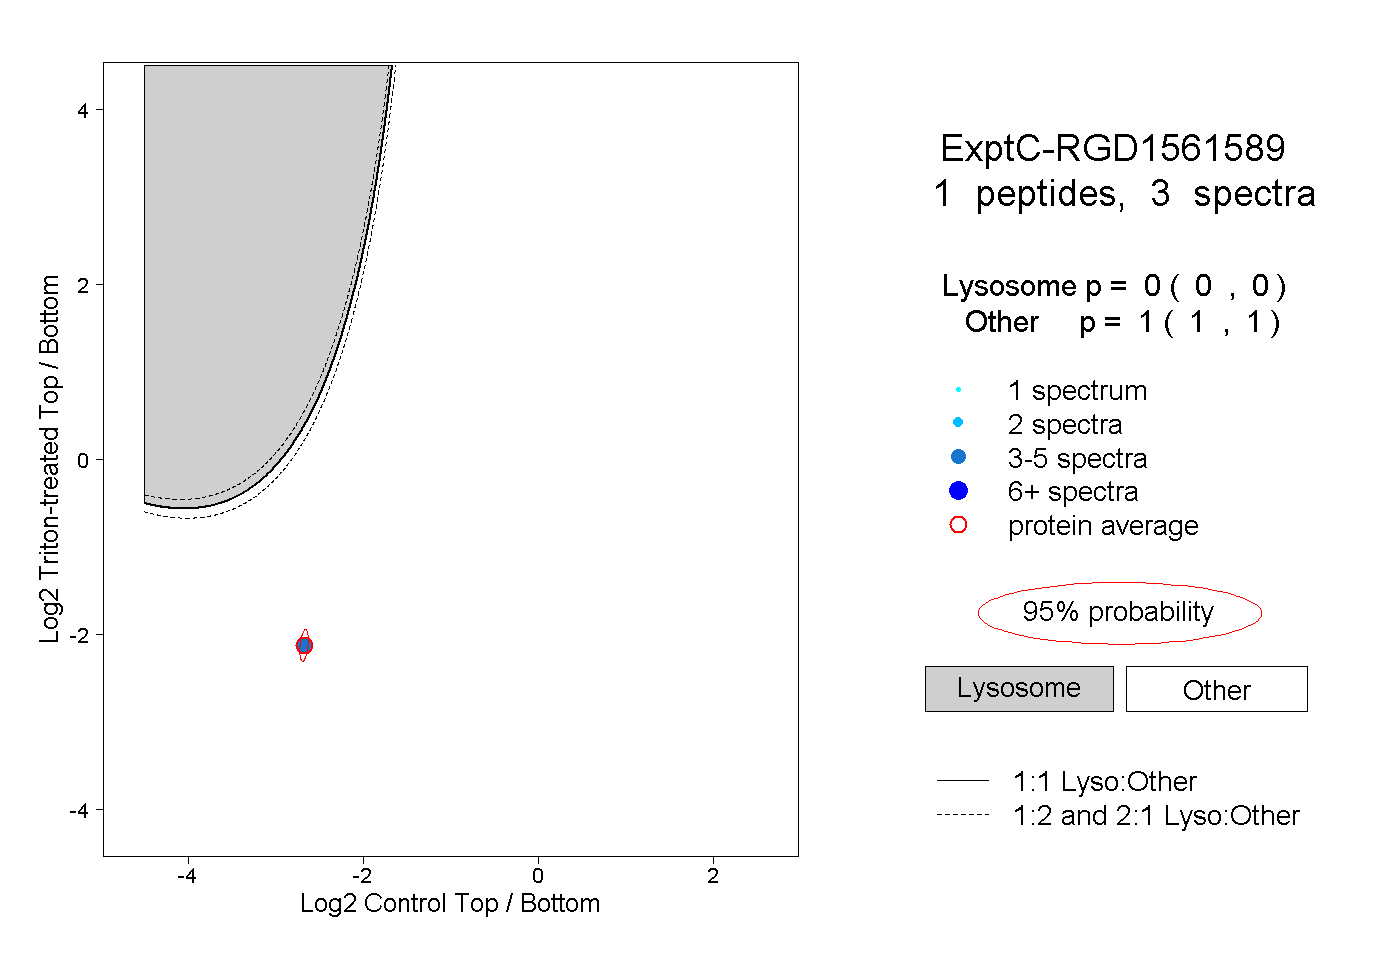
0.000 | 0.000
1.000 | 1.000
2peptides
spectra
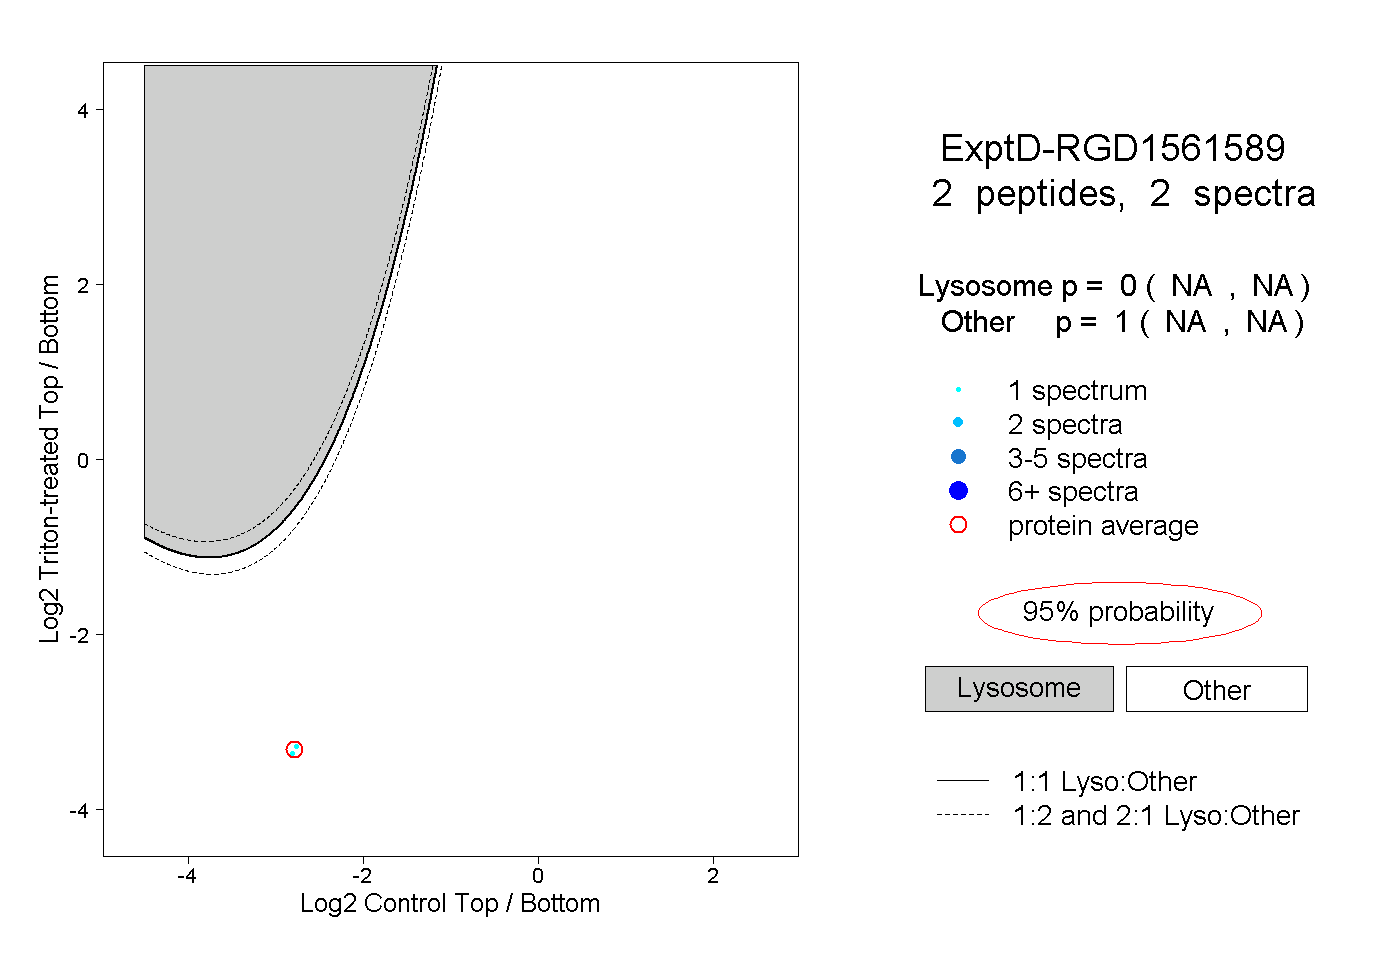
NA | NA
NA | NA