 2
2peptides
spectra
0.000 | 0.000
0.000 | 0.000
0.000 | 0.000
0.000 | 0.000
0.325 | 0.440
0.000 | 0.000
0.549 | 0.659
0.000 | 0.000
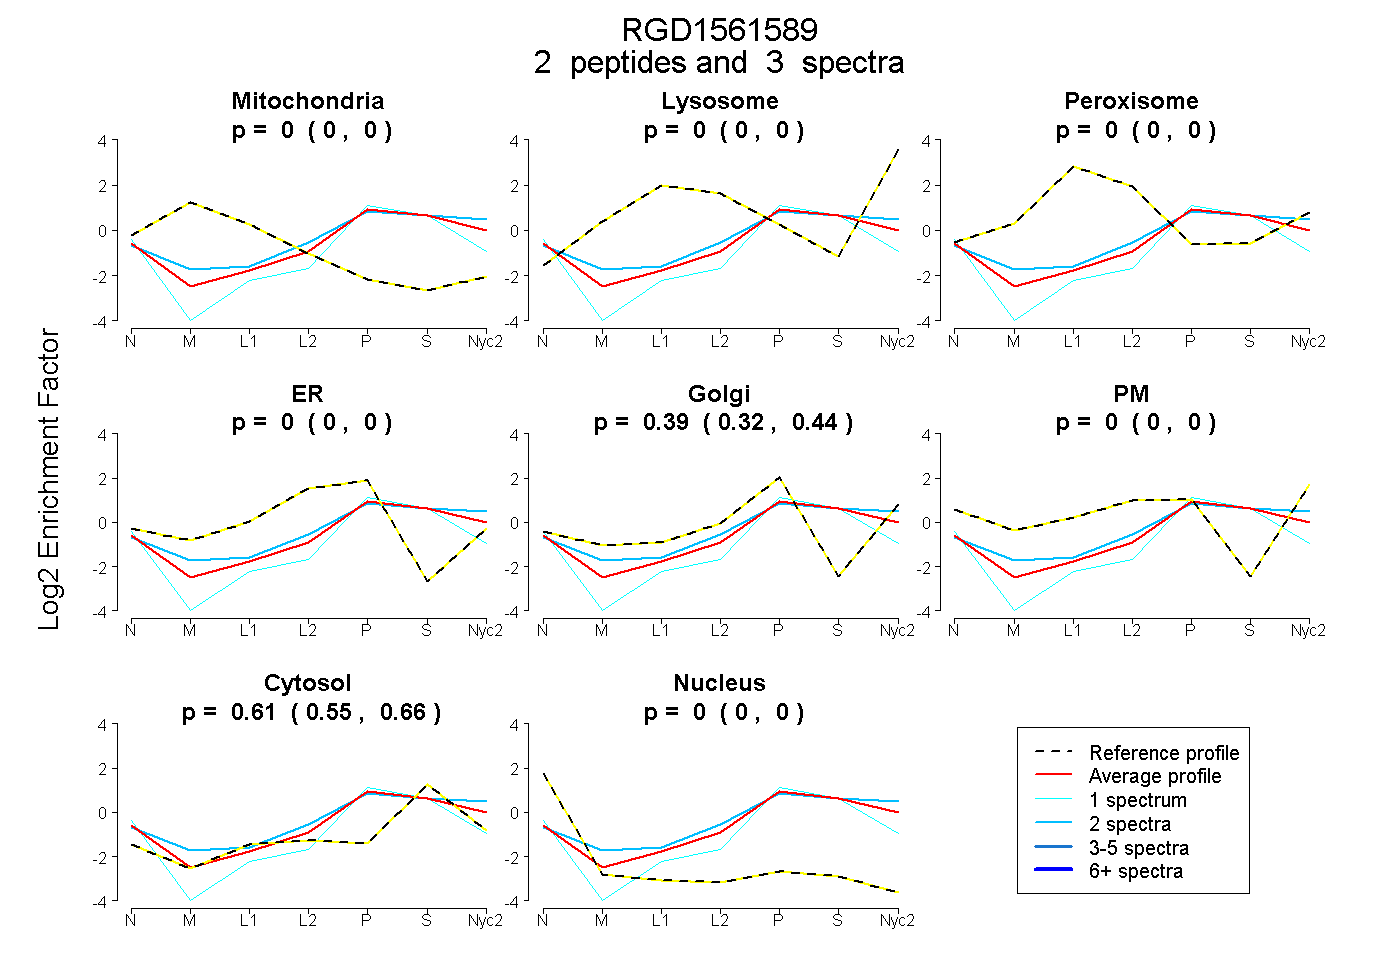
| Plot | Mito | Lyso | Perox | ER | Golgi | PM | Cytosol | Nucleus | |||||
| Expt A |
2 peptides |
3 spectra |
|
0.000 0.000 | 0.000 |
0.000 0.000 | 0.000 |
0.000 0.000 | 0.000 |
0.000 0.000 | 0.000 |
0.387 0.325 | 0.440 |
0.000 0.000 | 0.000 |
0.613 0.549 | 0.659 |
0.000 0.000 | 0.000 |
| 2 spectra, DDGTVIHFNNPK | 0.000 | 0.031 | 0.000 | 0.000 | 0.421 | 0.000 | 0.548 | 0.000 | ||
| 1 spectrum, LAEQFPR | 0.000 | 0.000 | 0.000 | 0.000 | 0.243 | 0.000 | 0.665 | 0.092 |
| Plot | Mito | Lyso or Perox | ER | Golgi | PM | Cytosol | Nucleus | ||||||
| Expt B |
1 peptide |
3 spectra |
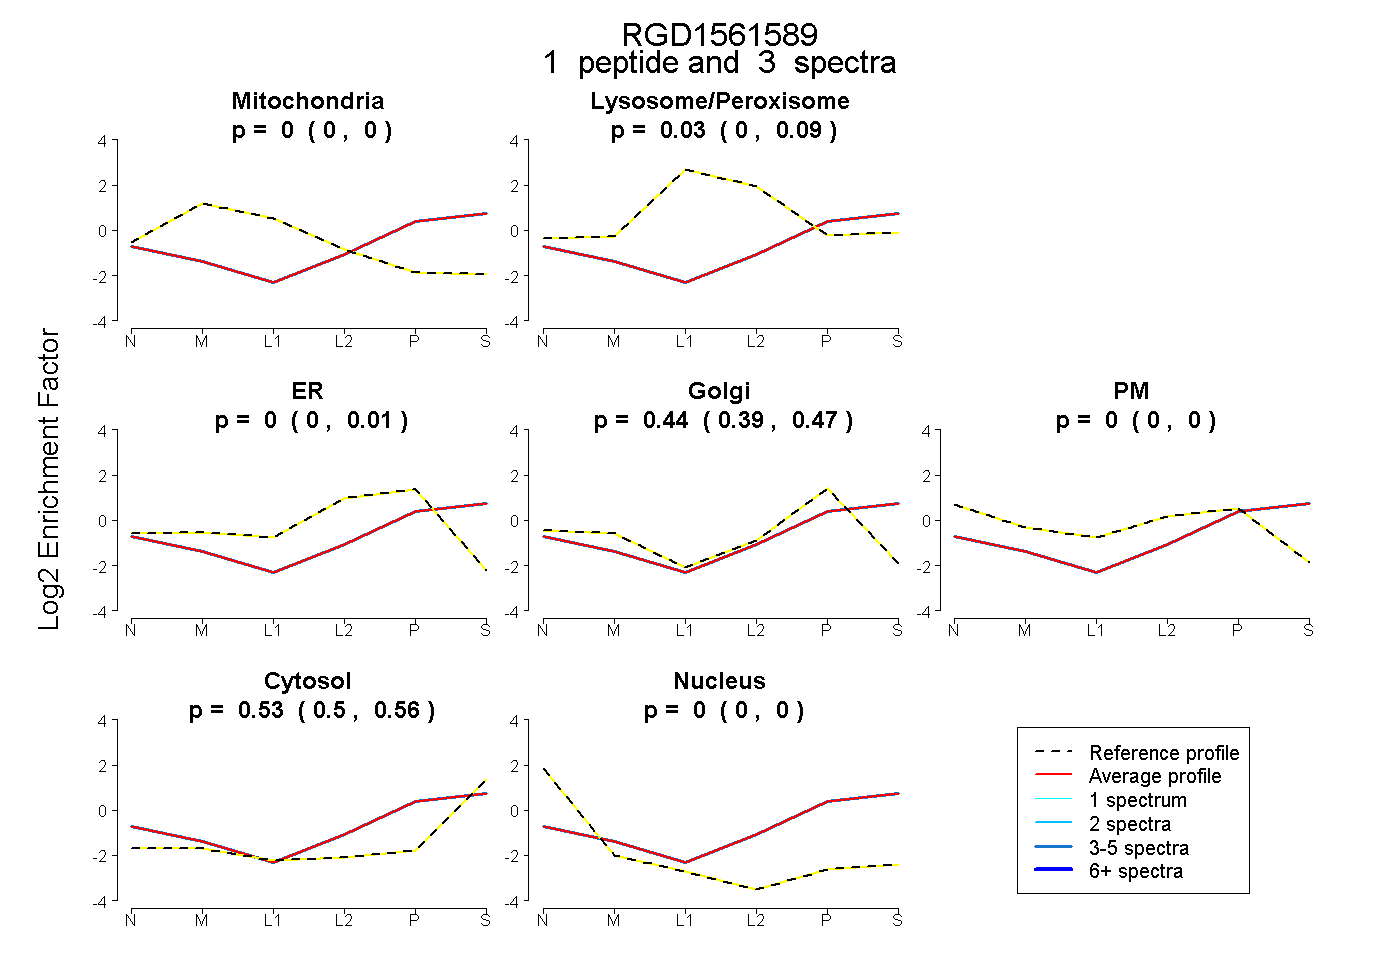 |
0.000 0.000 | 0.000 |
0.029 0.000 | 0.086 |
0.000 0.000 | 0.014 |
0.440 0.385 | 0.472 |
0.000 0.000 | 0.000 |
0.531 0.499 | 0.557 |
0.000 0.000 | 0.000 |
|||
| Plot | Lyso | Other | |||||||||||
| Expt C |
1 peptide |
3 spectra |
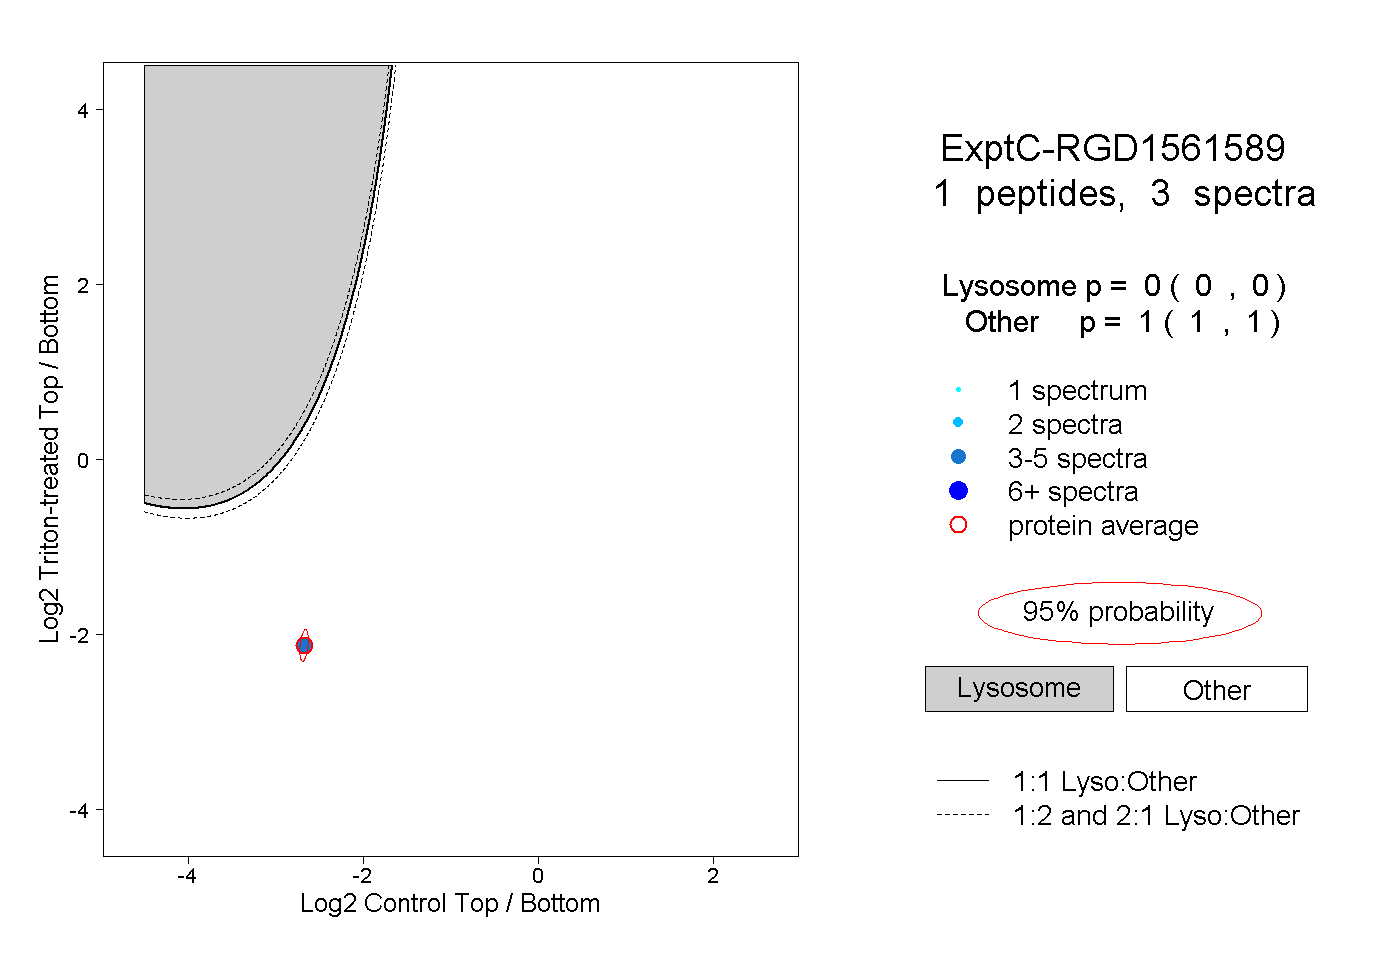 |
0.000 0.000 | 0.000 |
1.000 1.000 | 1.000 |
||||||||
| Plot | Lyso | Other | |||||||||||
| Expt D |
2 peptides |
2 spectra |
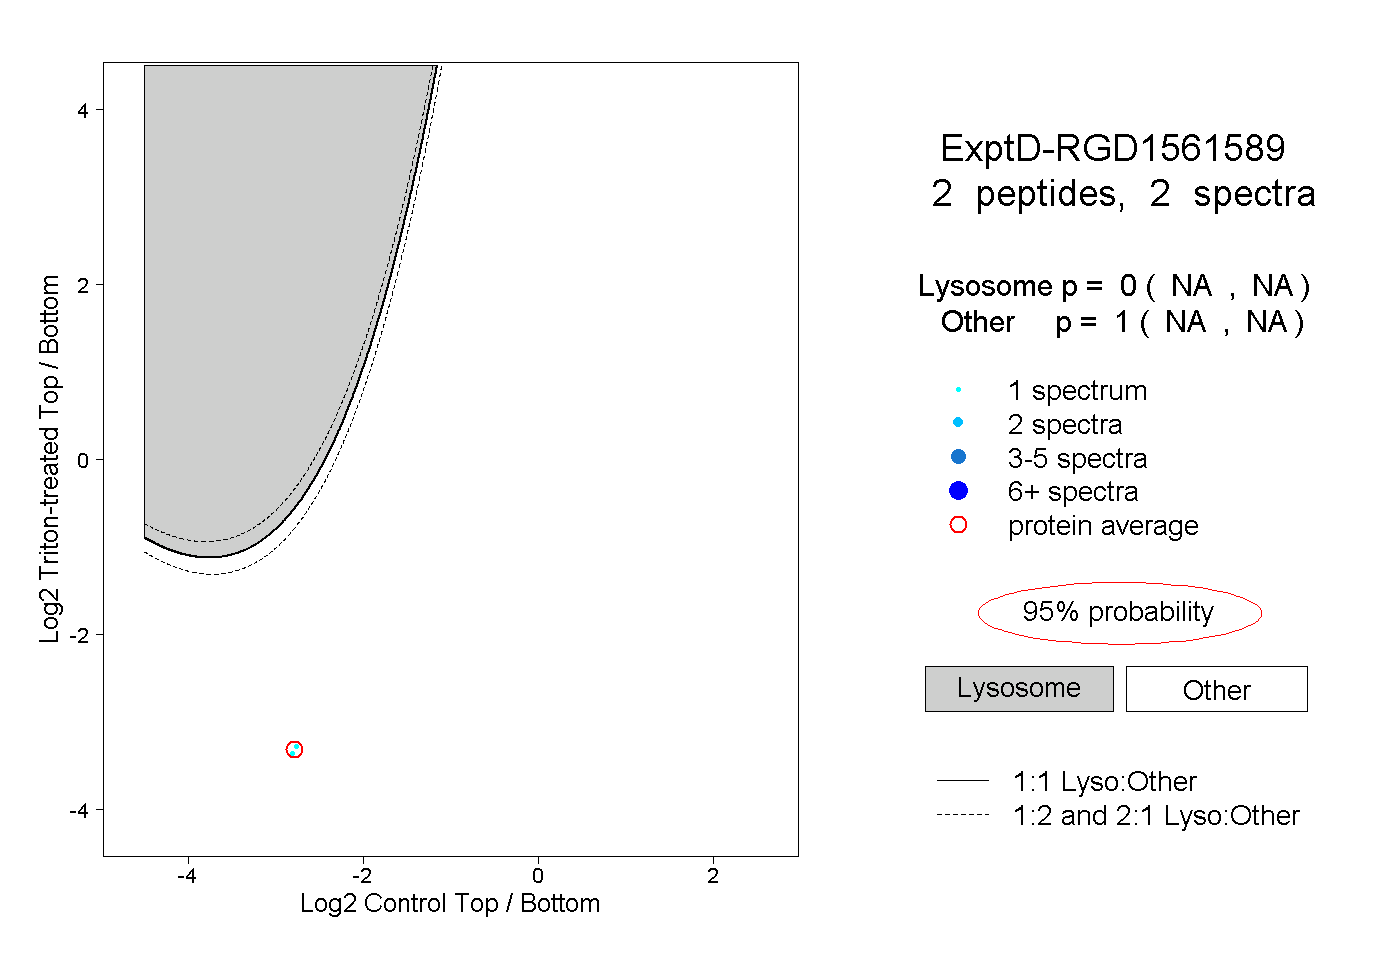 |
0.000 NA | NA |
1.000 NA | NA |