 7
7peptides
spectra
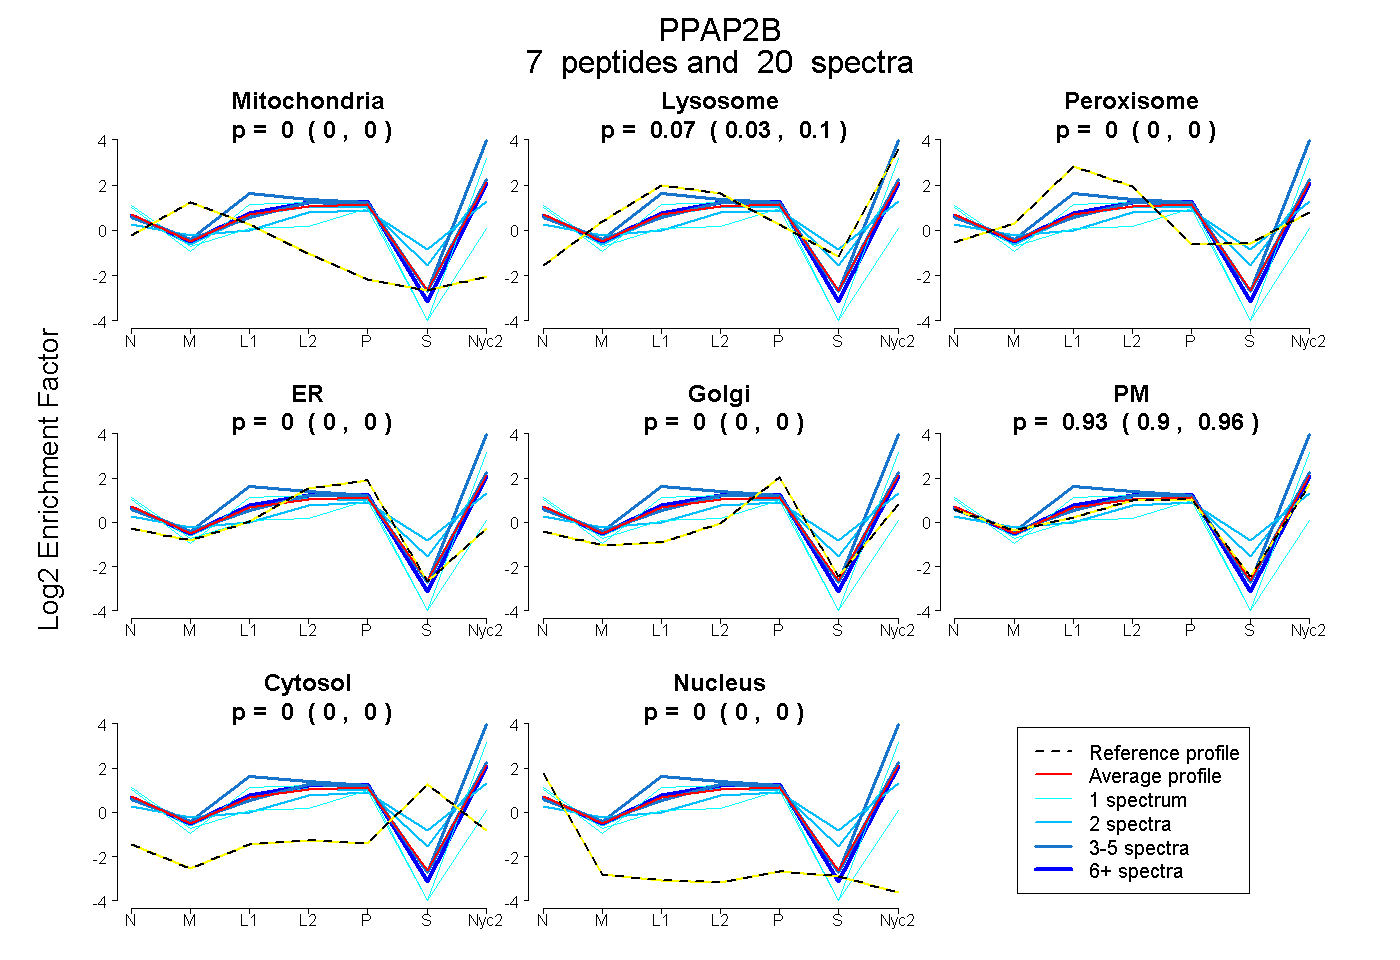
0.000 | 0.000
0.033 | 0.096
0.000 | 0.000
0.000 | 0.000
0.000 | 0.000
0.898 | 0.959
0.000 | 0.000
0.000 | 0.000
1peptide
spectra
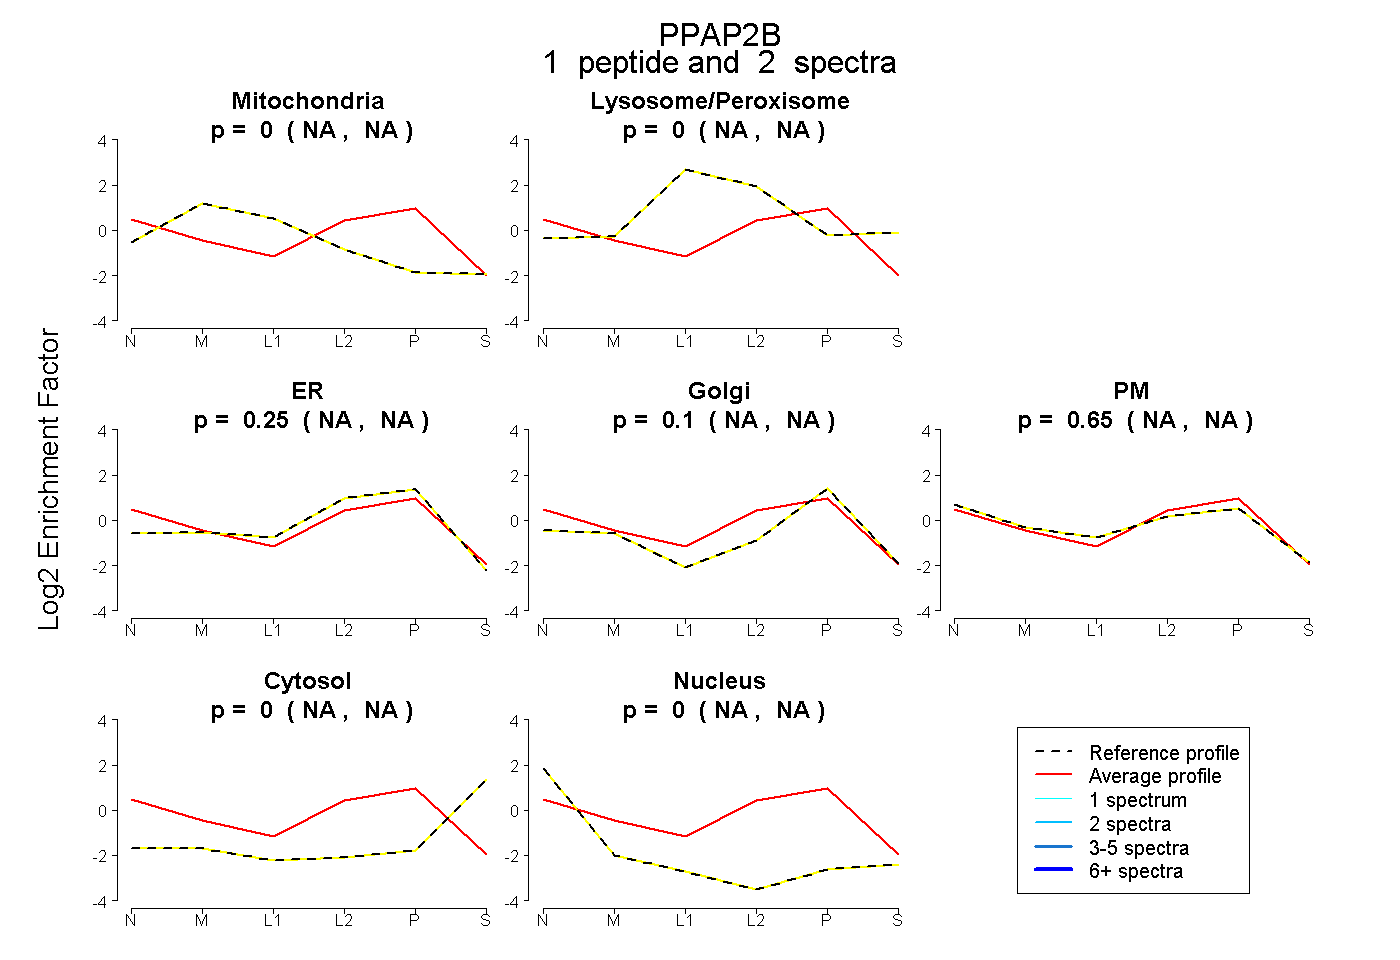
NA | NA
NA | NA
NA | NA
NA | NA
NA | NA
NA | NA
NA | NA
5peptides
spectra
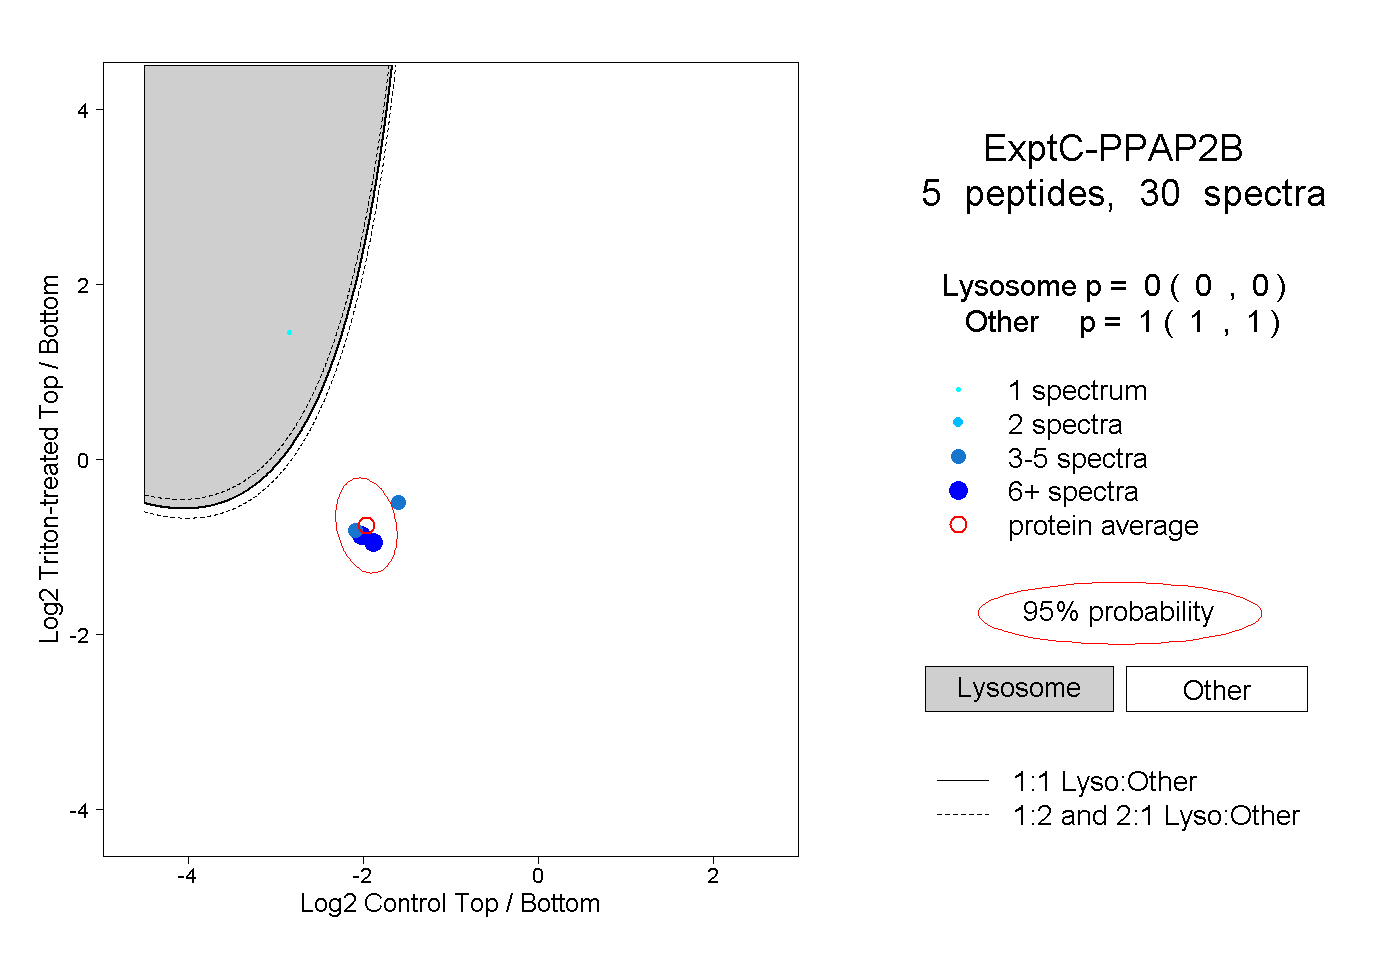
0.000 | 0.000
1.000 | 1.000
3peptides
spectra
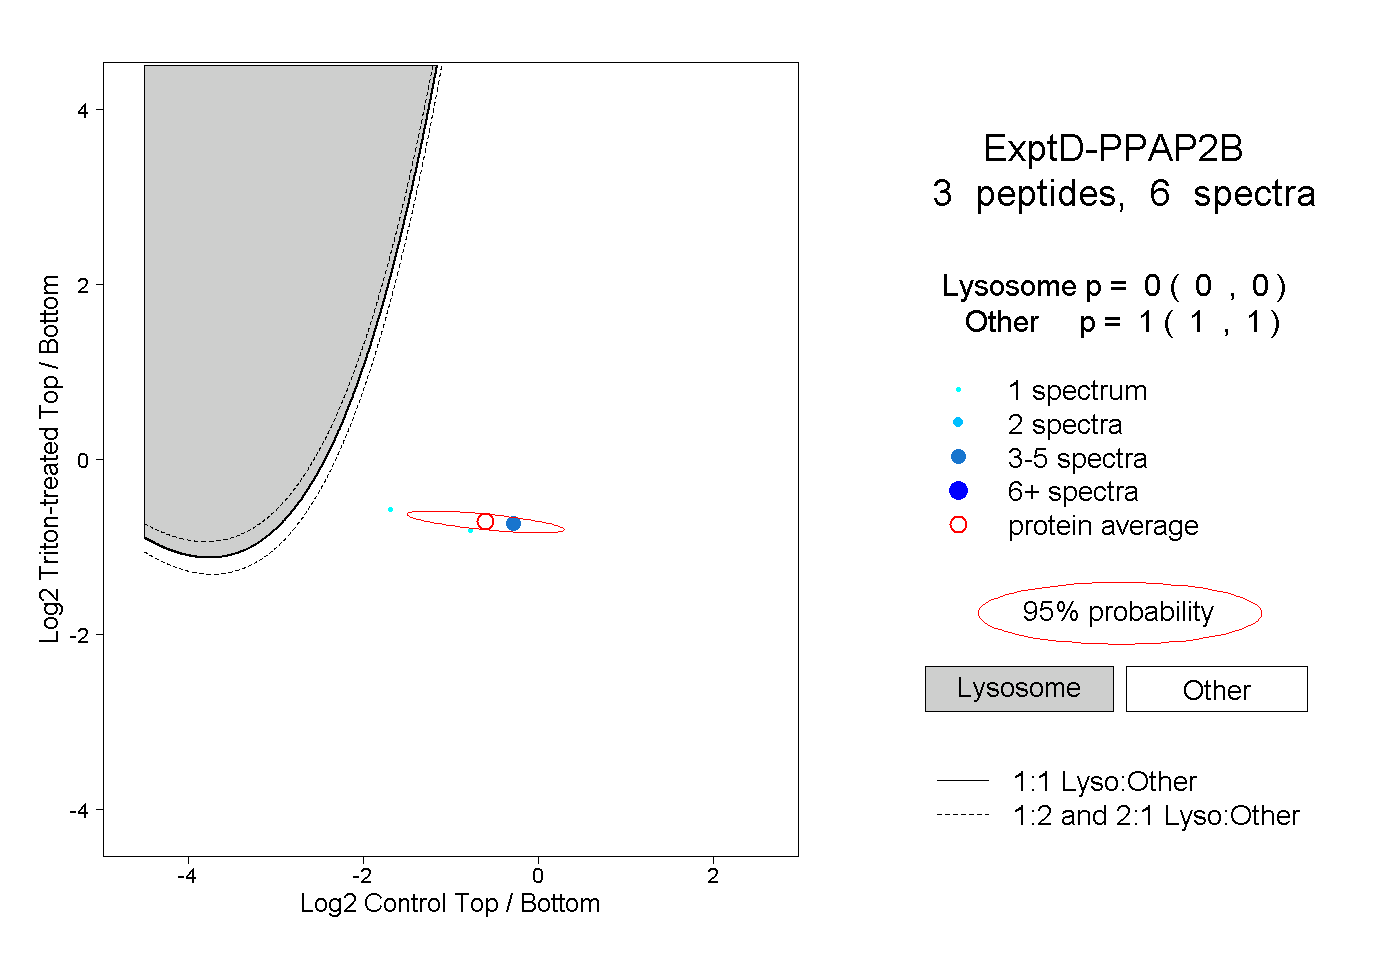
0.000 | 0.000
1.000 | 1.000