 9
9peptides
spectra
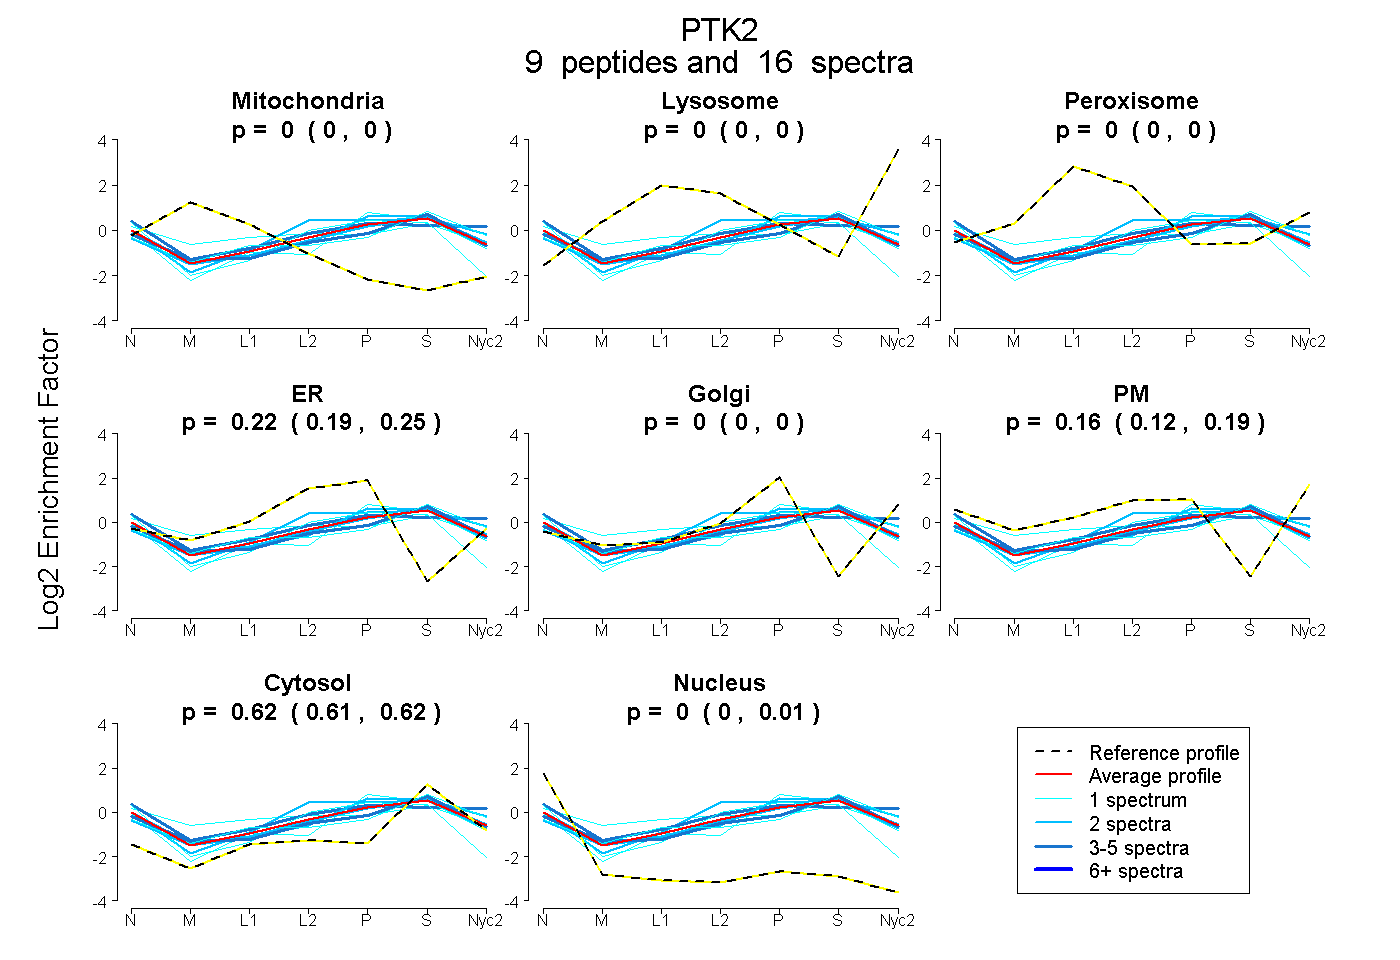
0.000 | 0.000
0.000 | 0.000
0.000 | 0.000
0.189 | 0.251
0.000 | 0.000
0.122 | 0.186
0.610 | 0.623
0.000 | 0.010
2peptides
spectra
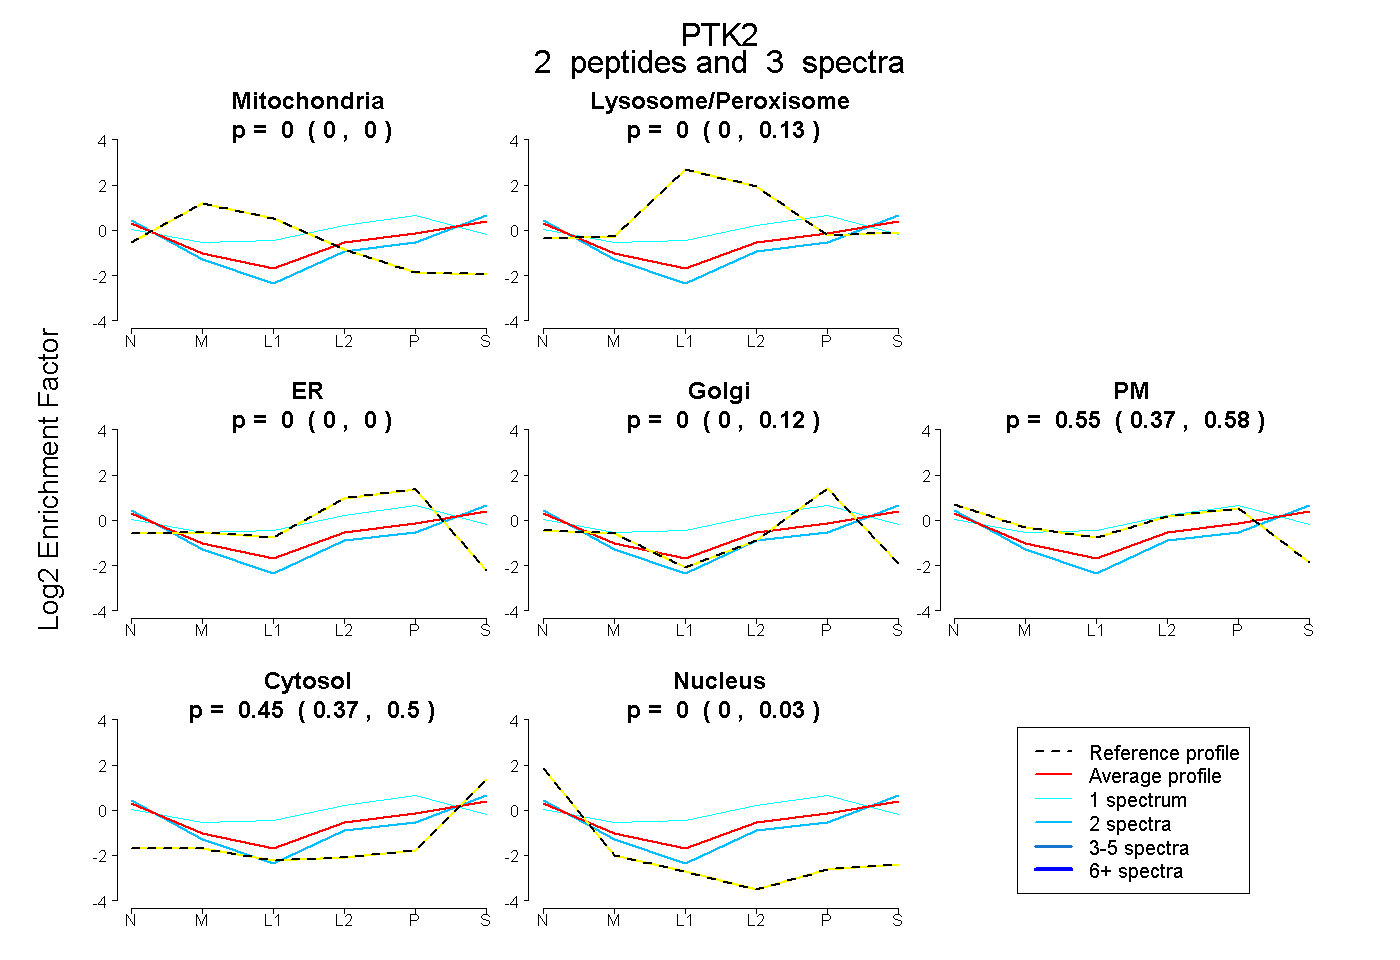
0.000 | 0.000
0.000 | 0.127
0.000 | 0.000
0.000 | 0.119
0.369 | 0.575
0.369 | 0.500
0.000 | 0.029
8peptides
spectra
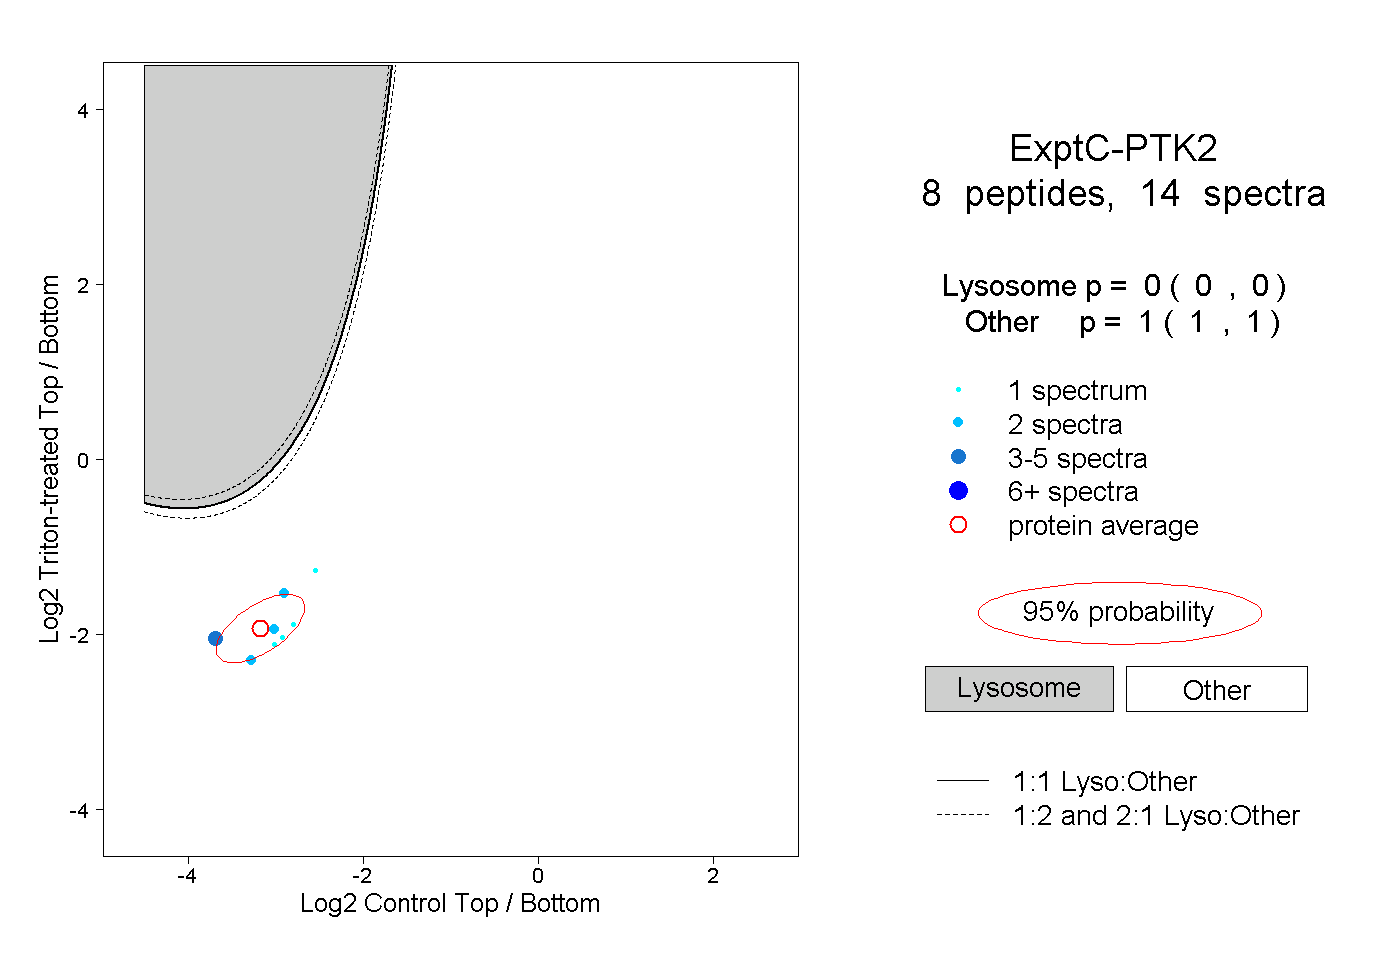
0.000 | 0.000
1.000 | 1.000