 9
9peptides
spectra
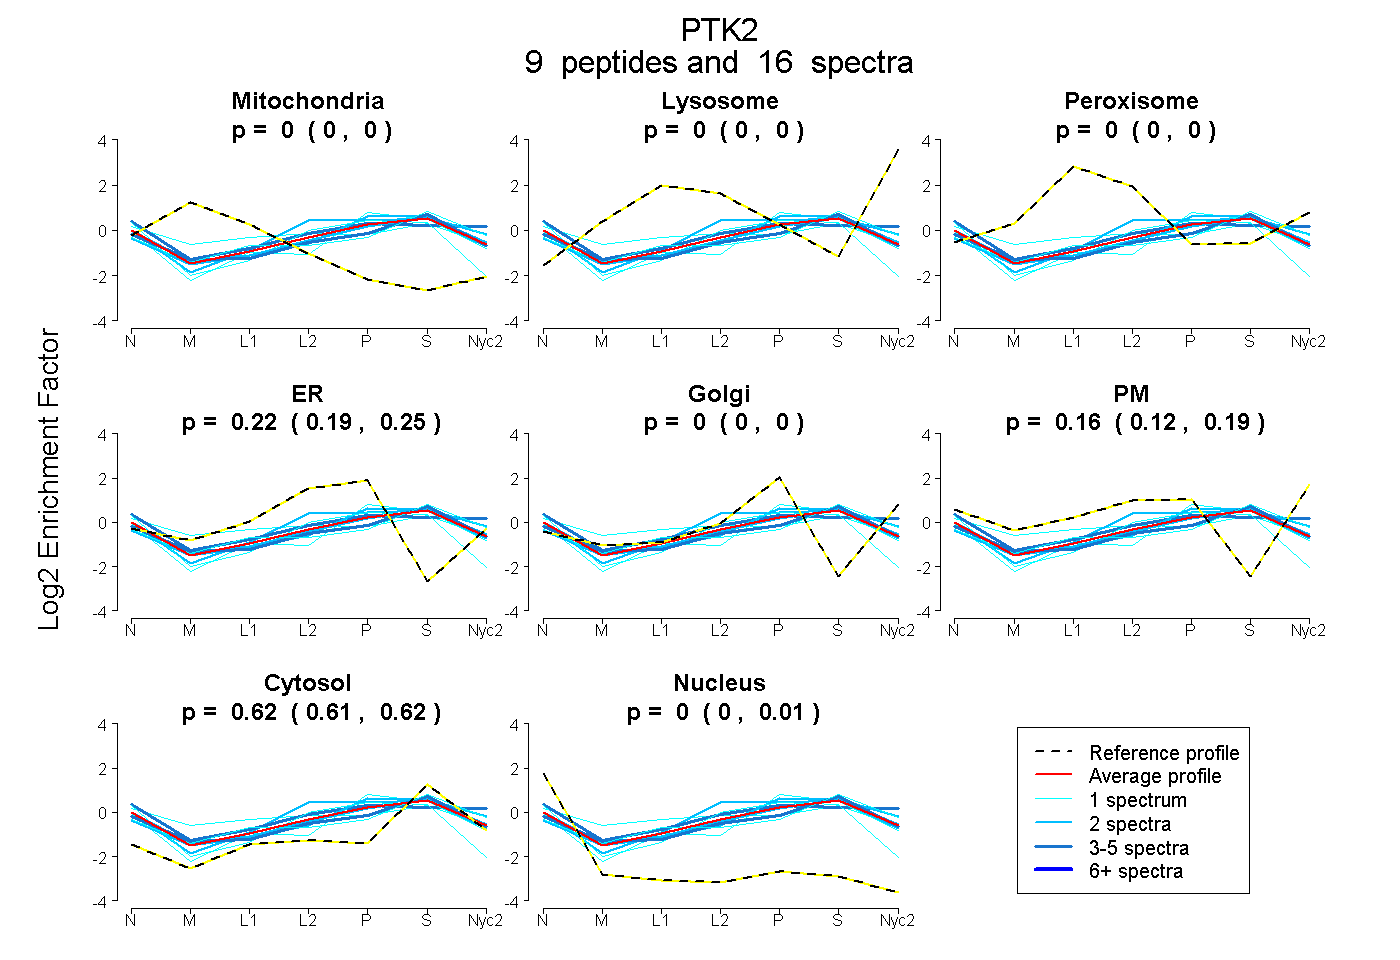
0.000 | 0.000
0.000 | 0.000
0.000 | 0.000
0.189 | 0.251
0.000 | 0.000
0.122 | 0.186
0.610 | 0.623
0.000 | 0.010
| Plot | Mito | Lyso | Perox | ER | Golgi | PM | Cytosol | Nucleus | |||||
| Expt A |
9 peptides |
16 spectra |
|
0.000 0.000 | 0.000 |
0.000 0.000 | 0.000 |
0.000 0.000 | 0.000 |
0.223 0.189 | 0.251 |
0.000 0.000 | 0.000 |
0.157 0.122 | 0.186 |
0.618 0.610 | 0.623 |
0.003 0.000 | 0.010 |
| 1 spectrum, LGDFGLSR | 0.000 | 0.000 | 0.000 | 0.068 | 0.314 | 0.000 | 0.589 | 0.029 | ||
| 3 spectra, QFDHPHIVK | 0.010 | 0.000 | 0.000 | 0.125 | 0.000 | 0.179 | 0.675 | 0.011 | ||
| 2 spectra, HGDATDVR | 0.000 | 0.000 | 0.021 | 0.404 | 0.000 | 0.000 | 0.575 | 0.000 | ||
| 1 spectrum, YMEDSTYYK | 0.000 | 0.000 | 0.087 | 0.000 | 0.000 | 0.235 | 0.678 | 0.000 | ||
| 3 spectra, LANNEK | 0.000 | 0.000 | 0.000 | 0.002 | 0.000 | 0.480 | 0.518 | 0.000 | ||
| 1 spectrum, NCTSDSVR | 0.000 | 0.000 | 0.000 | 0.363 | 0.000 | 0.000 | 0.511 | 0.126 | ||
| 2 spectra, QFANLNR | 0.000 | 0.000 | 0.000 | 0.034 | 0.052 | 0.293 | 0.621 | 0.000 | ||
| 1 spectrum, GNALEK | 0.086 | 0.000 | 0.183 | 0.095 | 0.000 | 0.152 | 0.459 | 0.025 | ||
| 2 spectra, MLGQTRPH | 0.000 | 0.000 | 0.005 | 0.139 | 0.258 | 0.000 | 0.598 | 0.000 |
| Plot | Mito | Lyso or Perox | ER | Golgi | PM | Cytosol | Nucleus | ||||||
| Expt B |
2 peptides |
3 spectra |
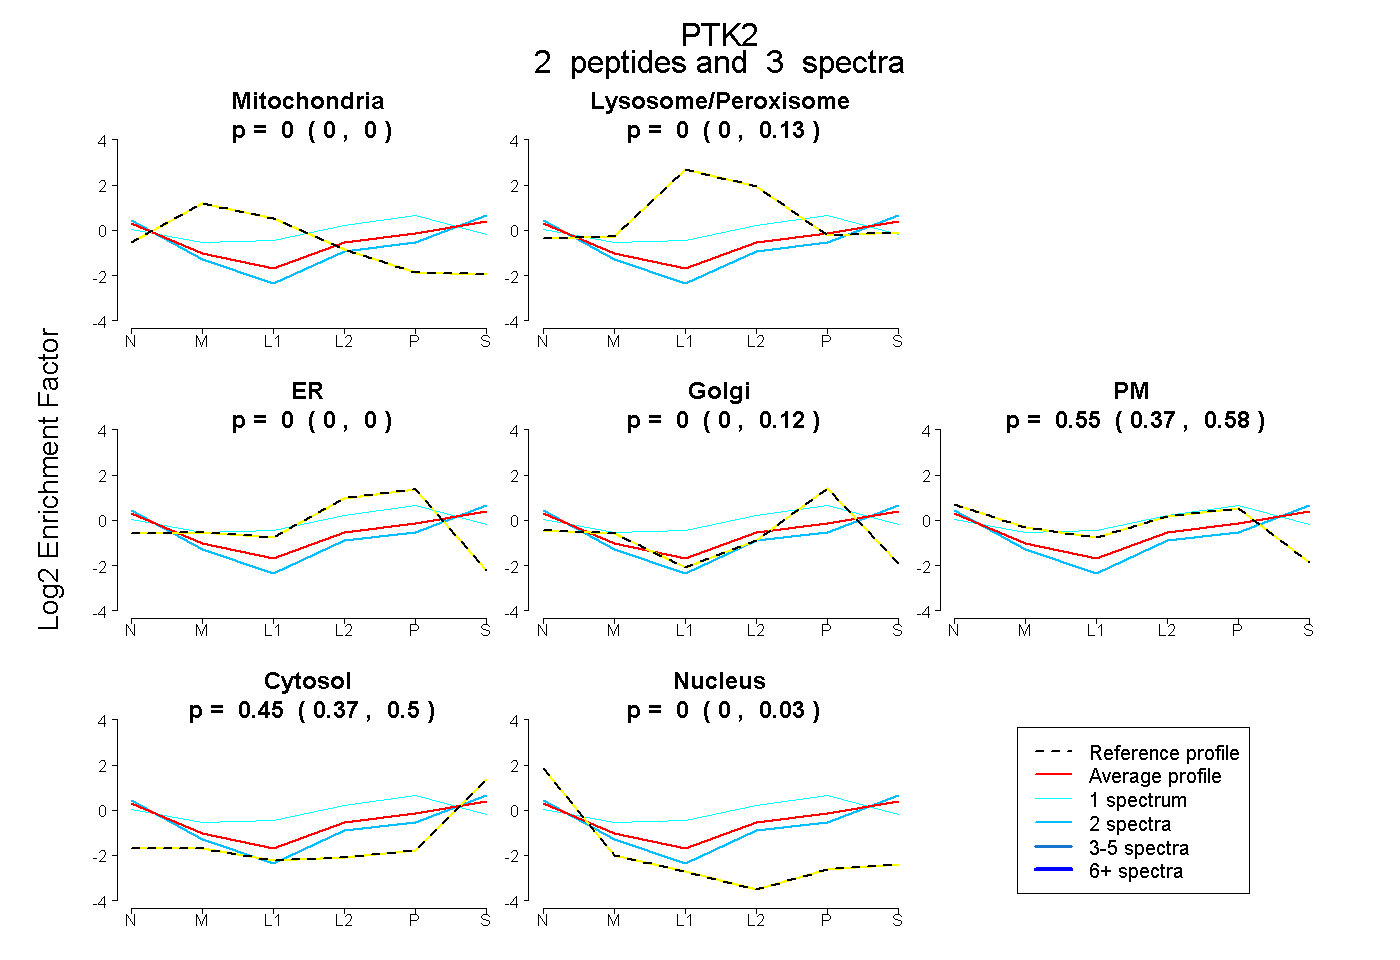 |
0.000 0.000 | 0.000 |
0.002 0.000 | 0.127 |
0.000 0.000 | 0.000 |
0.000 0.000 | 0.119 |
0.549 0.369 | 0.575 |
0.449 0.369 | 0.500 |
0.000 0.000 | 0.029 |
|||
| Plot | Lyso | Other | |||||||||||
| Expt C |
8 peptides |
14 spectra |
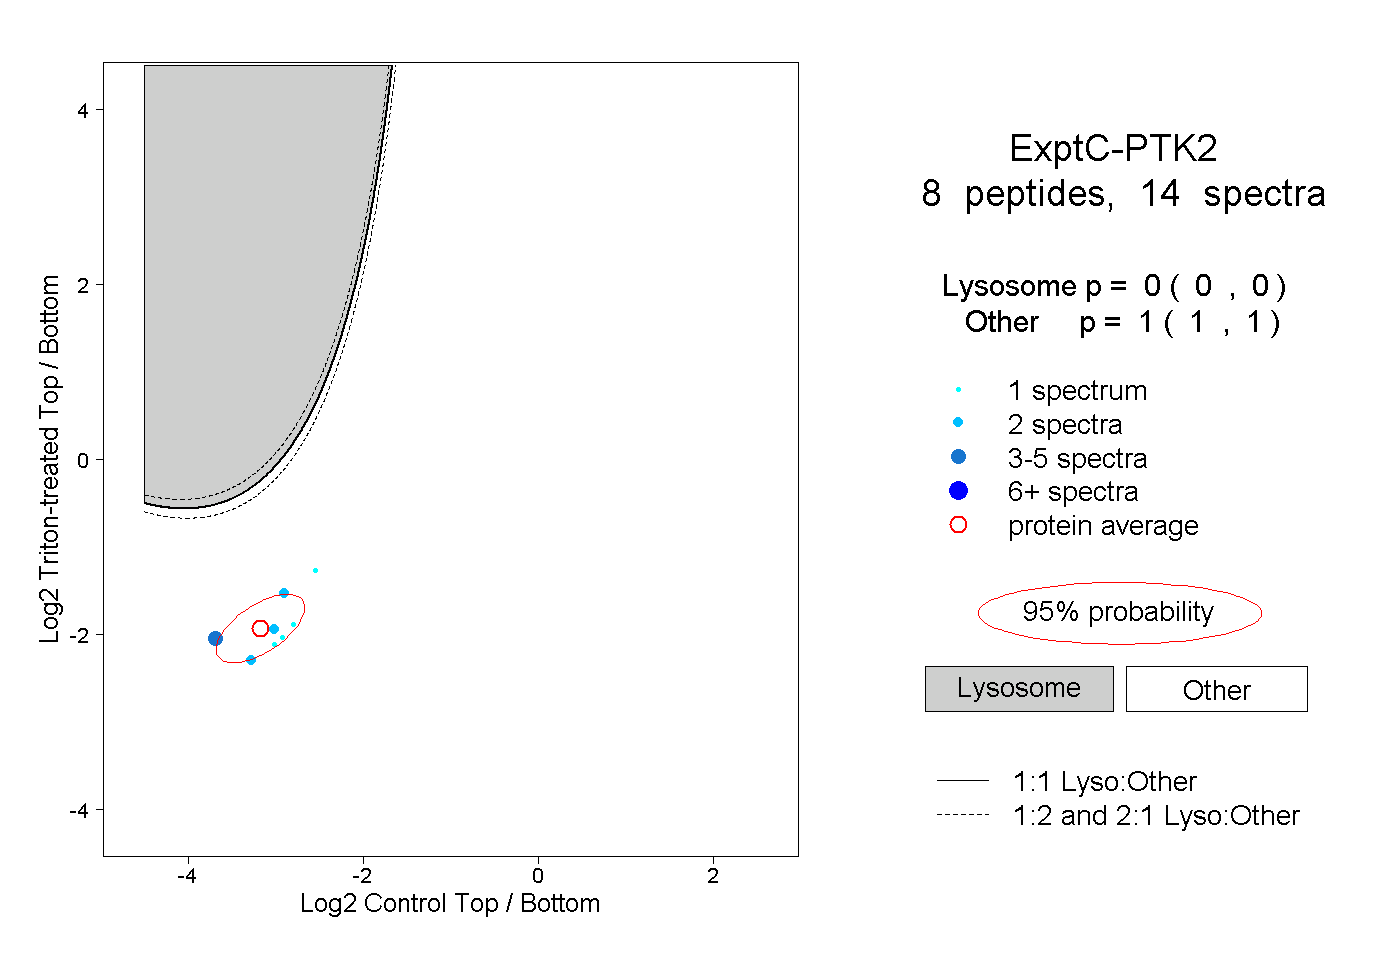 |
0.000 0.000 | 0.000 |
1.000 1.000 | 1.000 |