 11
11peptides
spectra
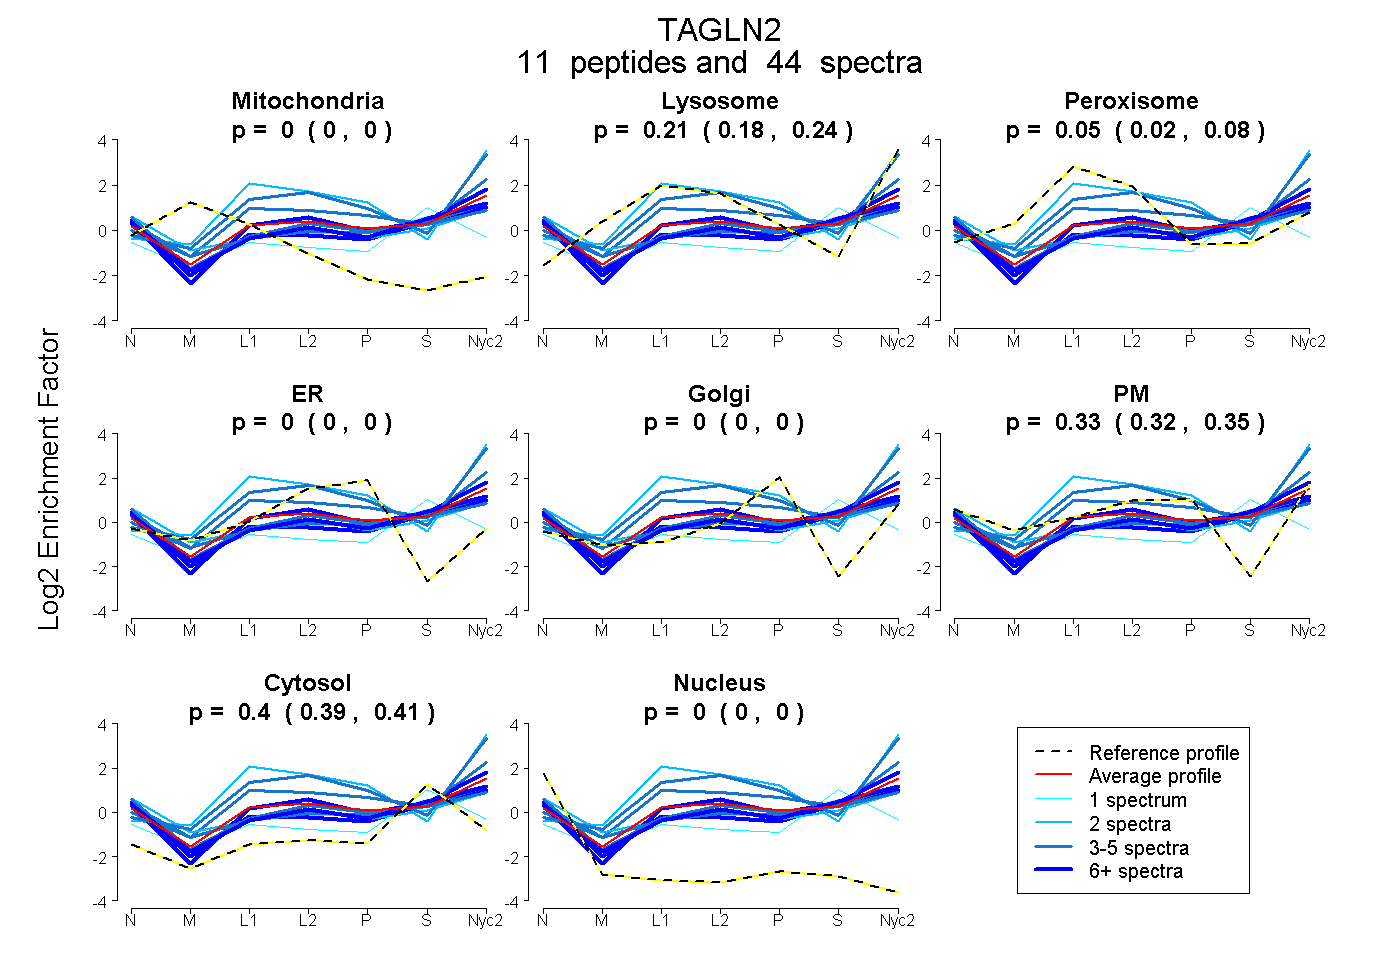
0.000 | 0.000
0.181 | 0.236
0.022 | 0.077
0.000 | 0.000
0.000 | 0.000
0.320 | 0.347
0.392 | 0.409
0.000 | 0.000
3peptides
spectra
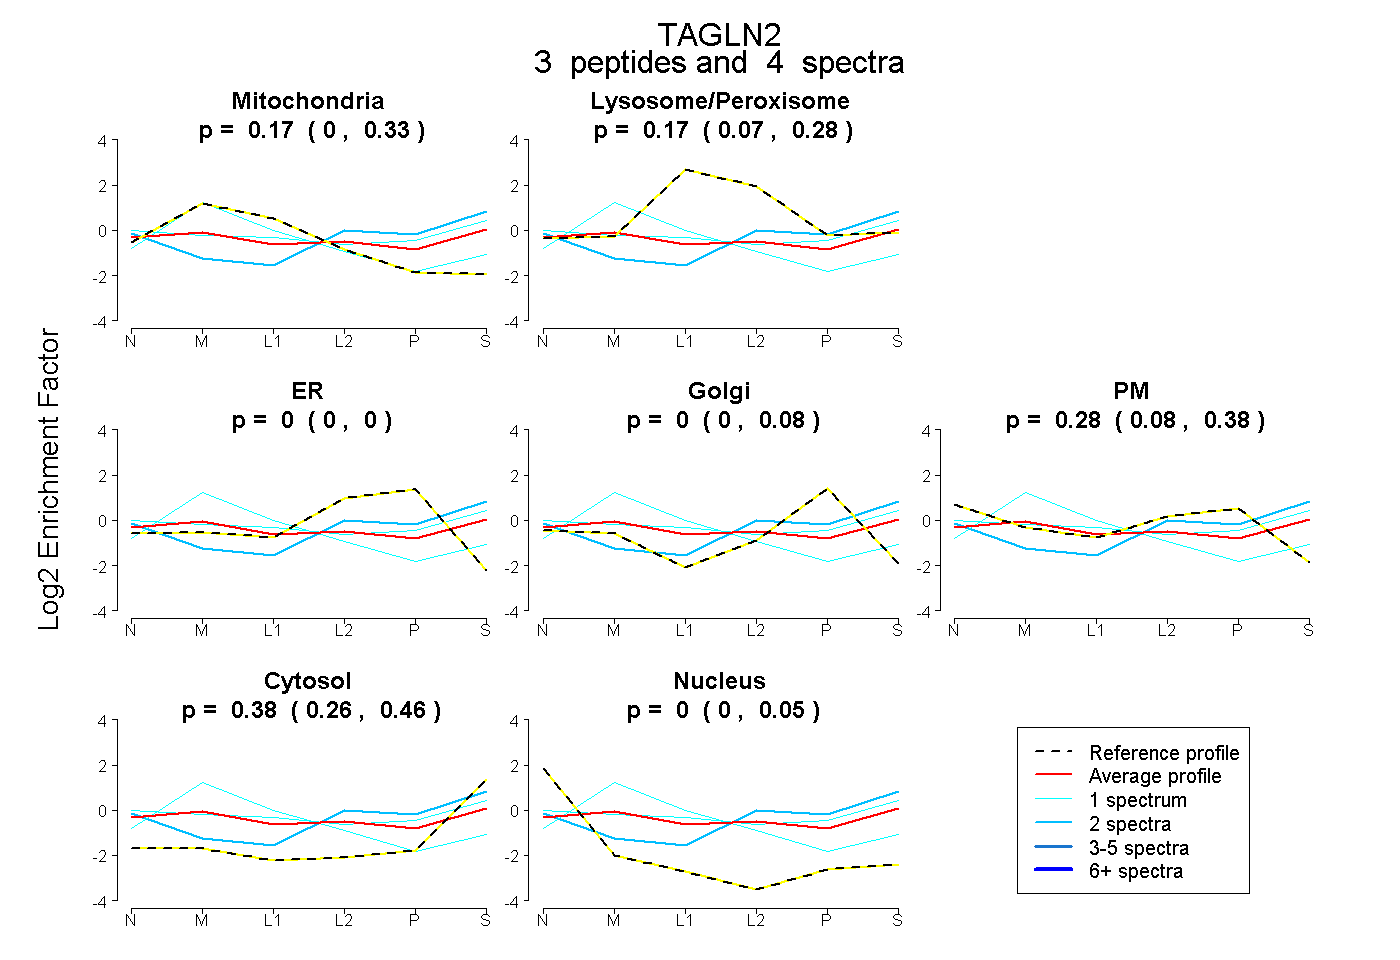
0.000 | 0.332
0.067 | 0.284
0.000 | 0.000
0.000 | 0.077
0.085 | 0.382
0.260 | 0.455
0.000 | 0.052
10peptides
spectra
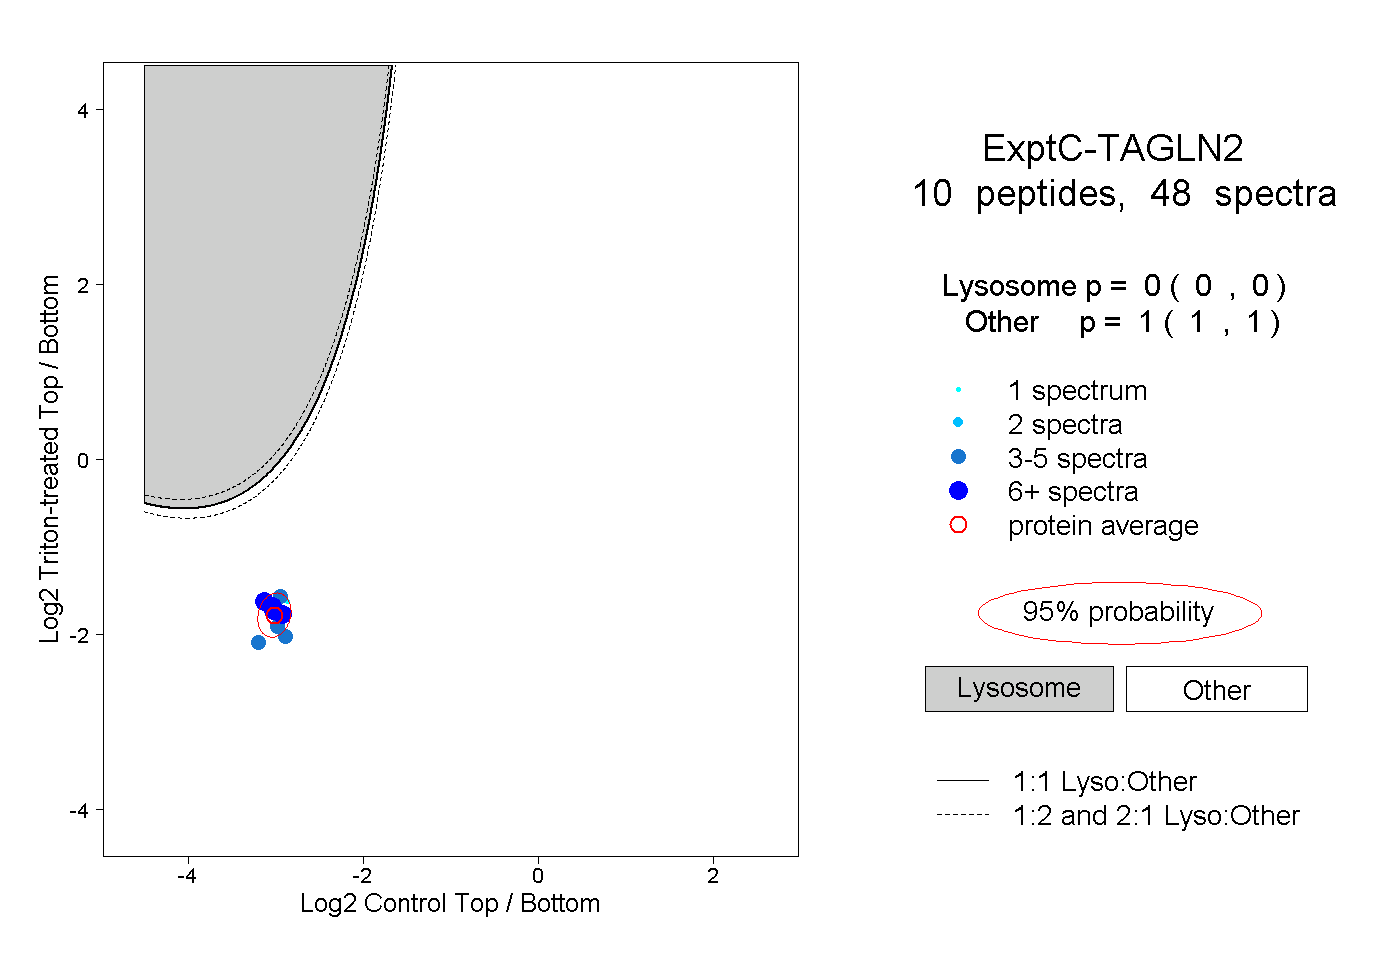
0.000 | 0.000
1.000 | 1.000
4peptides
spectra
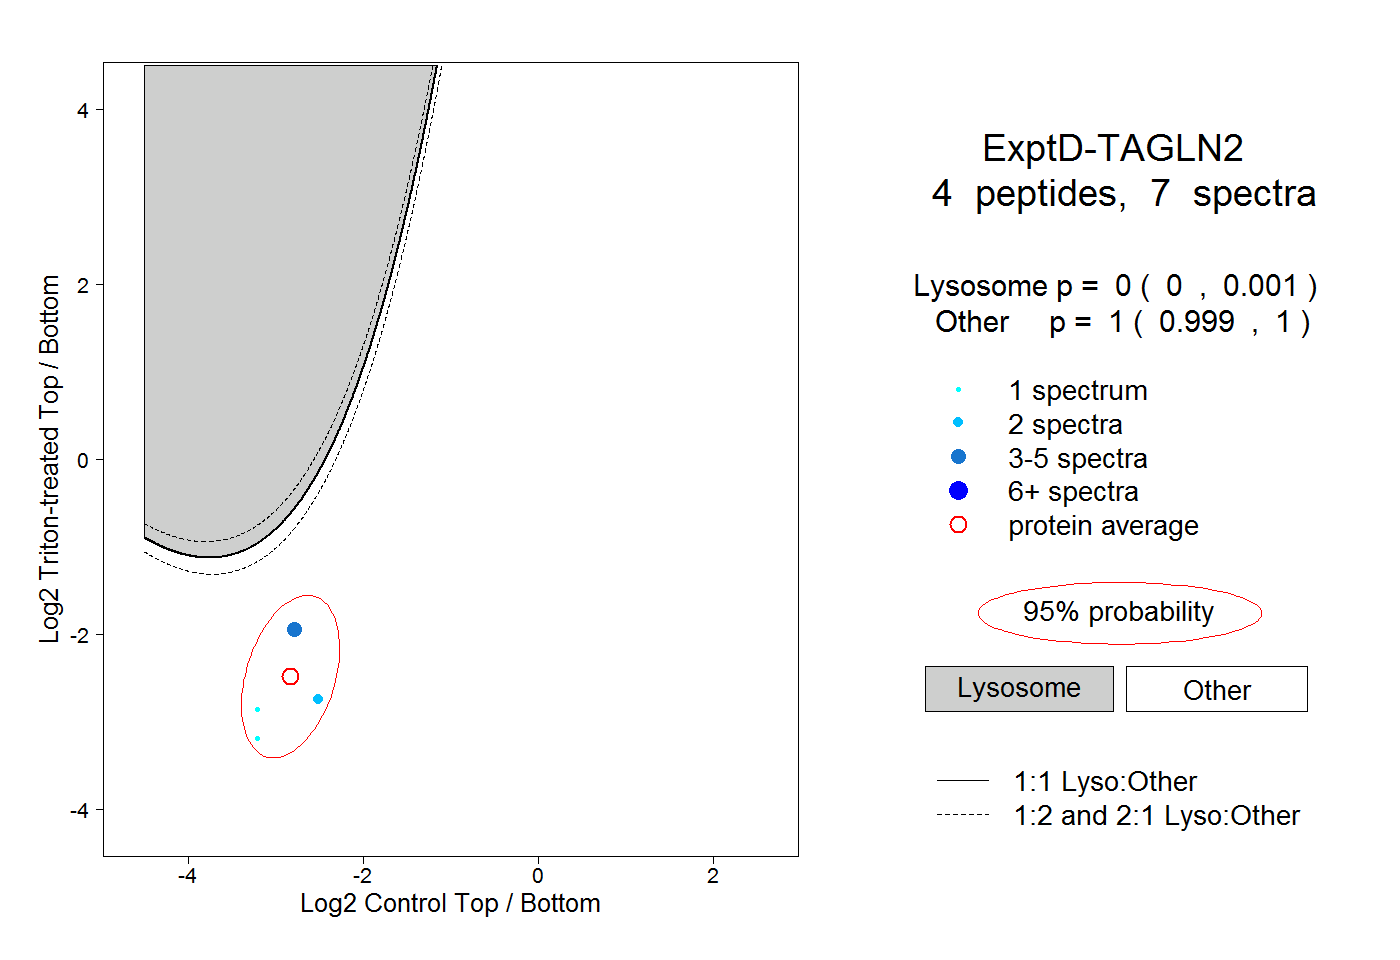
0.000 | 0.001
0.999 | 1.000