 11
11peptides
spectra
0.000 | 0.000
0.181 | 0.236
0.022 | 0.077
0.000 | 0.000
0.000 | 0.000
0.320 | 0.347
0.392 | 0.409
0.000 | 0.000
| Plot | Mito | Lyso | Perox | ER | Golgi | PM | Cytosol | Nucleus | |||||
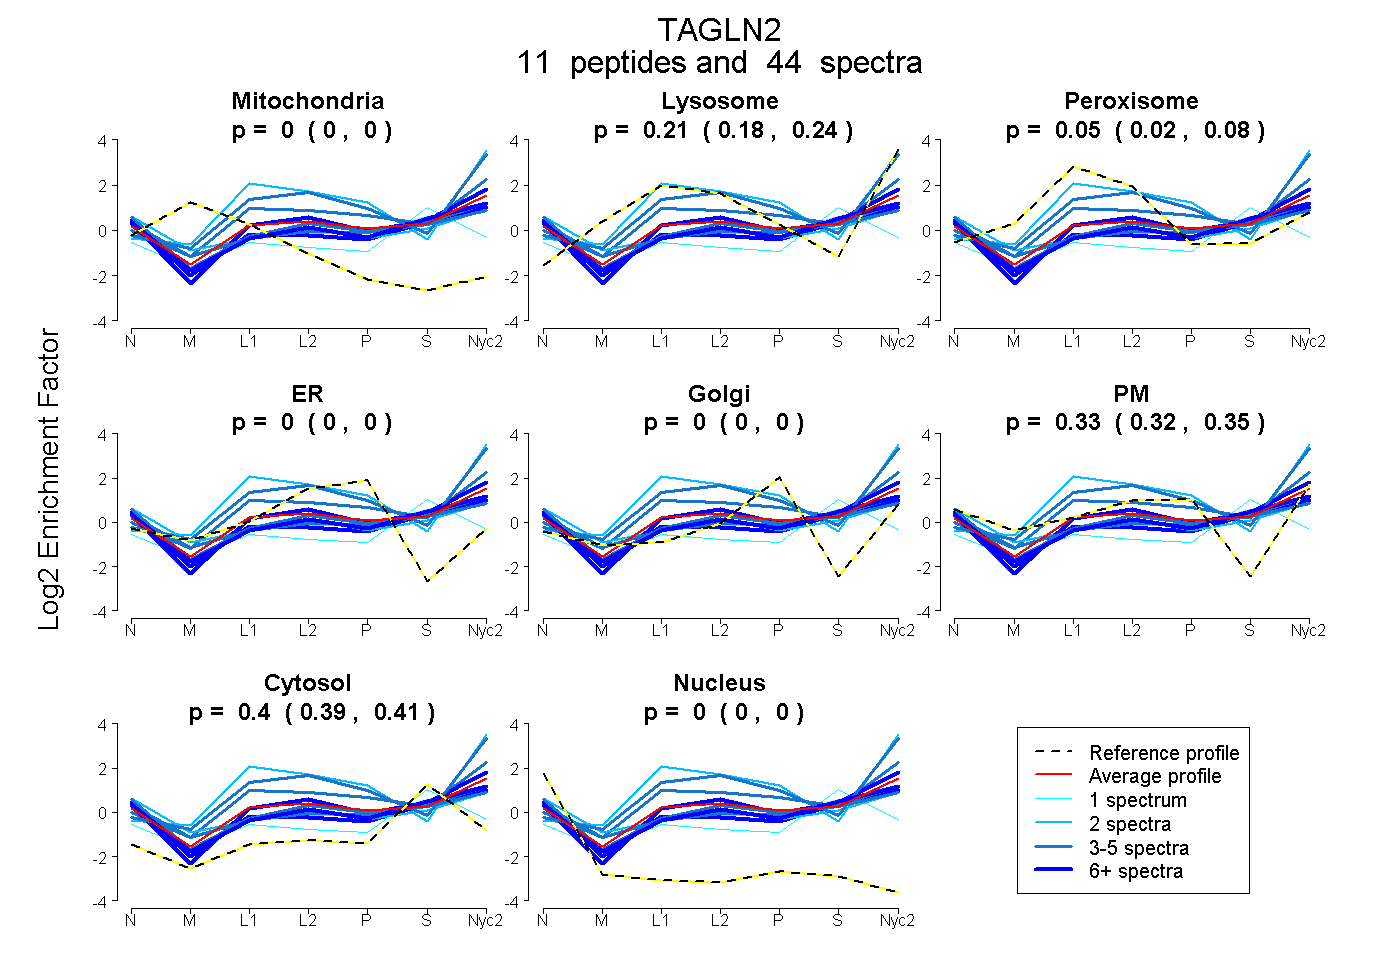
| Expt A |
11 peptides |
44 spectra |
|
0.000 0.000 | 0.000 |
0.212 0.181 | 0.236 |
0.053 0.022 | 0.077 |
0.000 0.000 | 0.000 |
0.000 0.000 | 0.000 |
0.334 0.320 | 0.347 |
0.401 0.392 | 0.409 |
0.000 0.000 | 0.000 |
| 8 spectra, NFSDNQLQEGK | 0.000 | 0.237 | 0.000 | 0.000 | 0.000 | 0.323 | 0.440 | 0.000 | ||
| 4 spectra, GPSYGLSR | 0.000 | 0.431 | 0.058 | 0.000 | 0.000 | 0.256 | 0.254 | 0.000 | ||
| 1 spectrum, ENFQNWLK | 0.000 | 0.095 | 0.029 | 0.000 | 0.000 | 0.340 | 0.536 | 0.000 | ||
| 2 spectra, GASQAGMTGYGMPR | 0.000 | 0.783 | 0.022 | 0.000 | 0.000 | 0.195 | 0.000 | 0.000 | ||
| 3 spectra, NMACVQR | 0.000 | 0.000 | 0.082 | 0.000 | 0.000 | 0.465 | 0.453 | 0.000 | ||
| 3 spectra, QMEQISQFLQAAER | 0.000 | 0.117 | 0.016 | 0.000 | 0.000 | 0.402 | 0.465 | 0.000 | ||
| 2 spectra, IQASTMAFK | 0.000 | 0.000 | 0.118 | 0.000 | 0.000 | 0.466 | 0.417 | 0.000 | ||
| 1 spectrum, DDGLFSGDPNWFPK | 0.000 | 0.000 | 0.169 | 0.000 | 0.000 | 0.087 | 0.737 | 0.007 | ||
| 5 spectra, NVIGLQMGTNR | 0.000 | 0.692 | 0.000 | 0.000 | 0.000 | 0.227 | 0.082 | 0.000 | ||
| 6 spectra, GVSQPQPGR | 0.000 | 0.021 | 0.064 | 0.000 | 0.000 | 0.388 | 0.528 | 0.000 | ||
| 9 spectra, TLMNLGGLAVAR | 0.000 | 0.100 | 0.020 | 0.000 | 0.000 | 0.368 | 0.512 | 0.000 |
| Plot | Mito | Lyso or Perox | ER | Golgi | PM | Cytosol | Nucleus | ||||||
| Expt B |
3 peptides |
4 spectra |
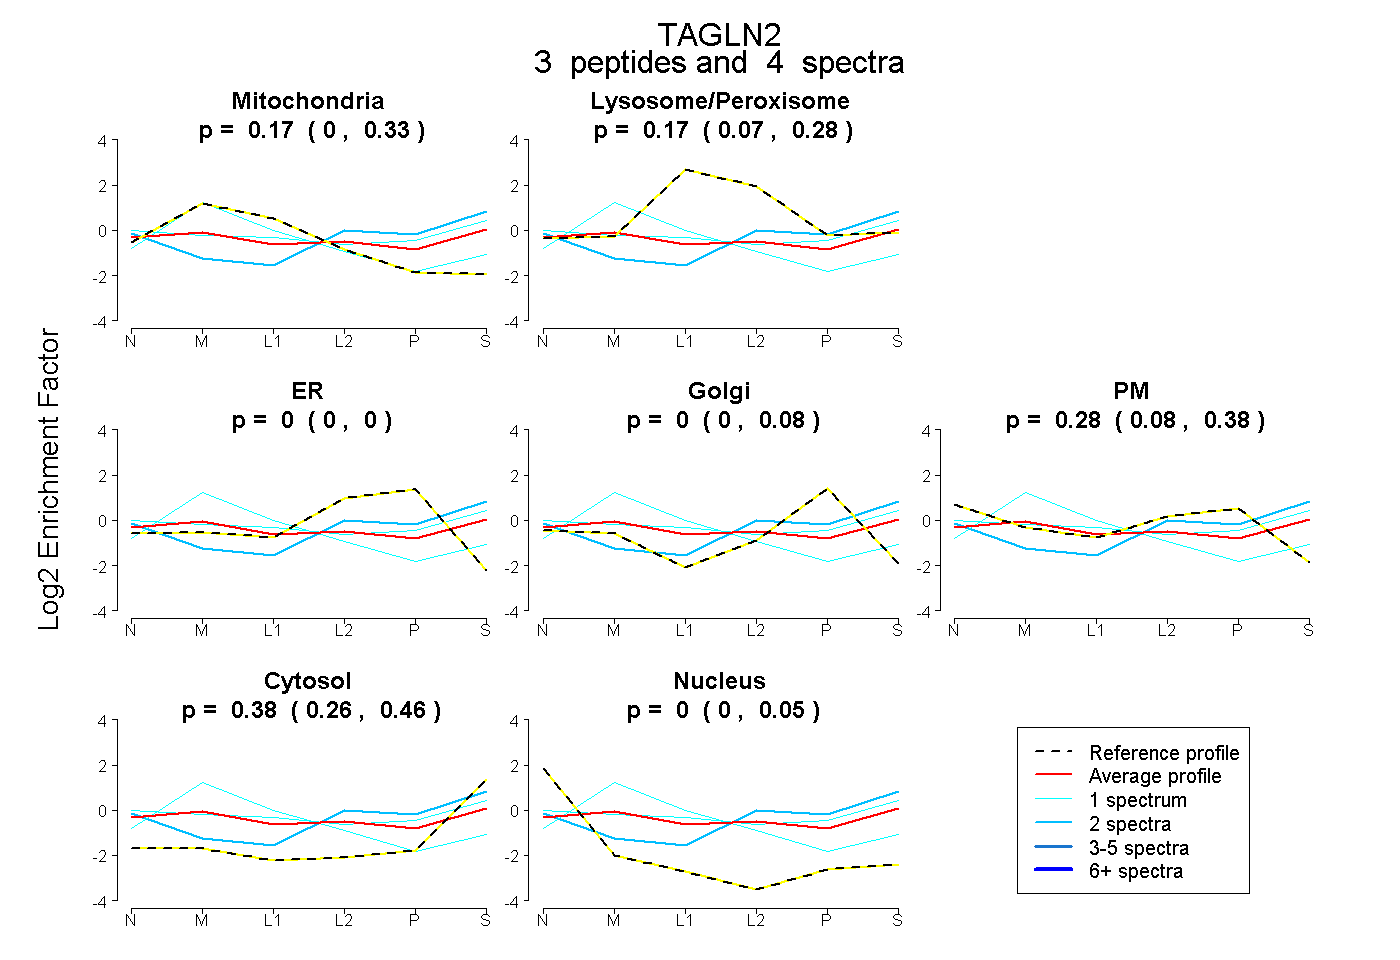 |
0.174 0.000 | 0.332 |
0.173 0.067 | 0.284 |
0.000 0.000 | 0.000 |
0.000 0.000 | 0.077 |
0.277 0.085 | 0.382 |
0.376 0.260 | 0.455 |
0.000 0.000 | 0.052 |
|||
| Plot | Lyso | Other | |||||||||||
| Expt C |
10 peptides |
48 spectra |
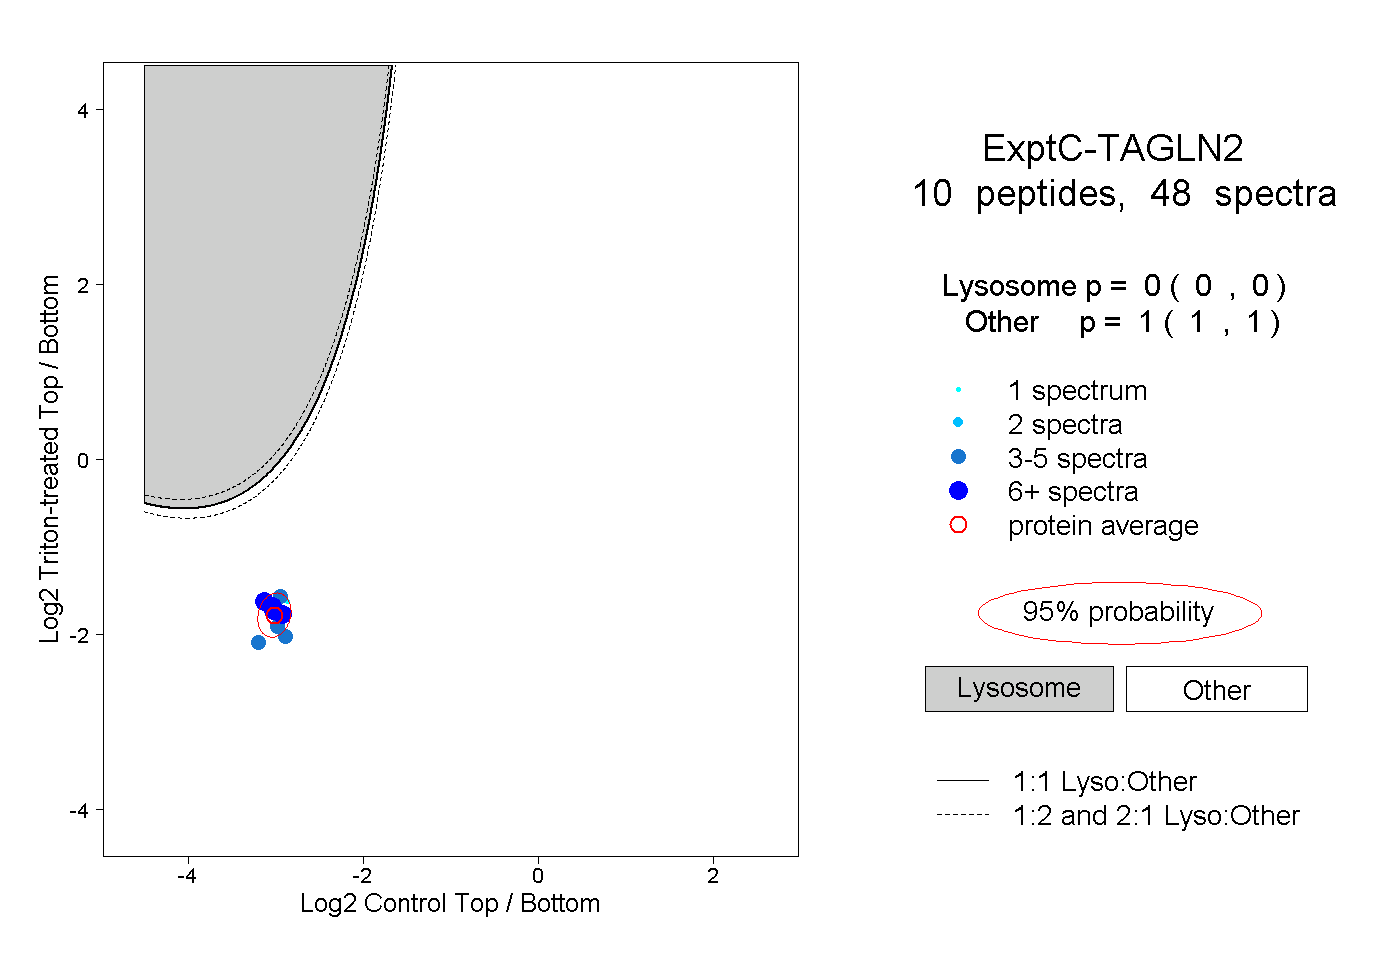 |
0.000 0.000 | 0.000 |
1.000 1.000 | 1.000 |
||||||||
| Plot | Lyso | Other | |||||||||||
| Expt D |
4 peptides |
7 spectra |
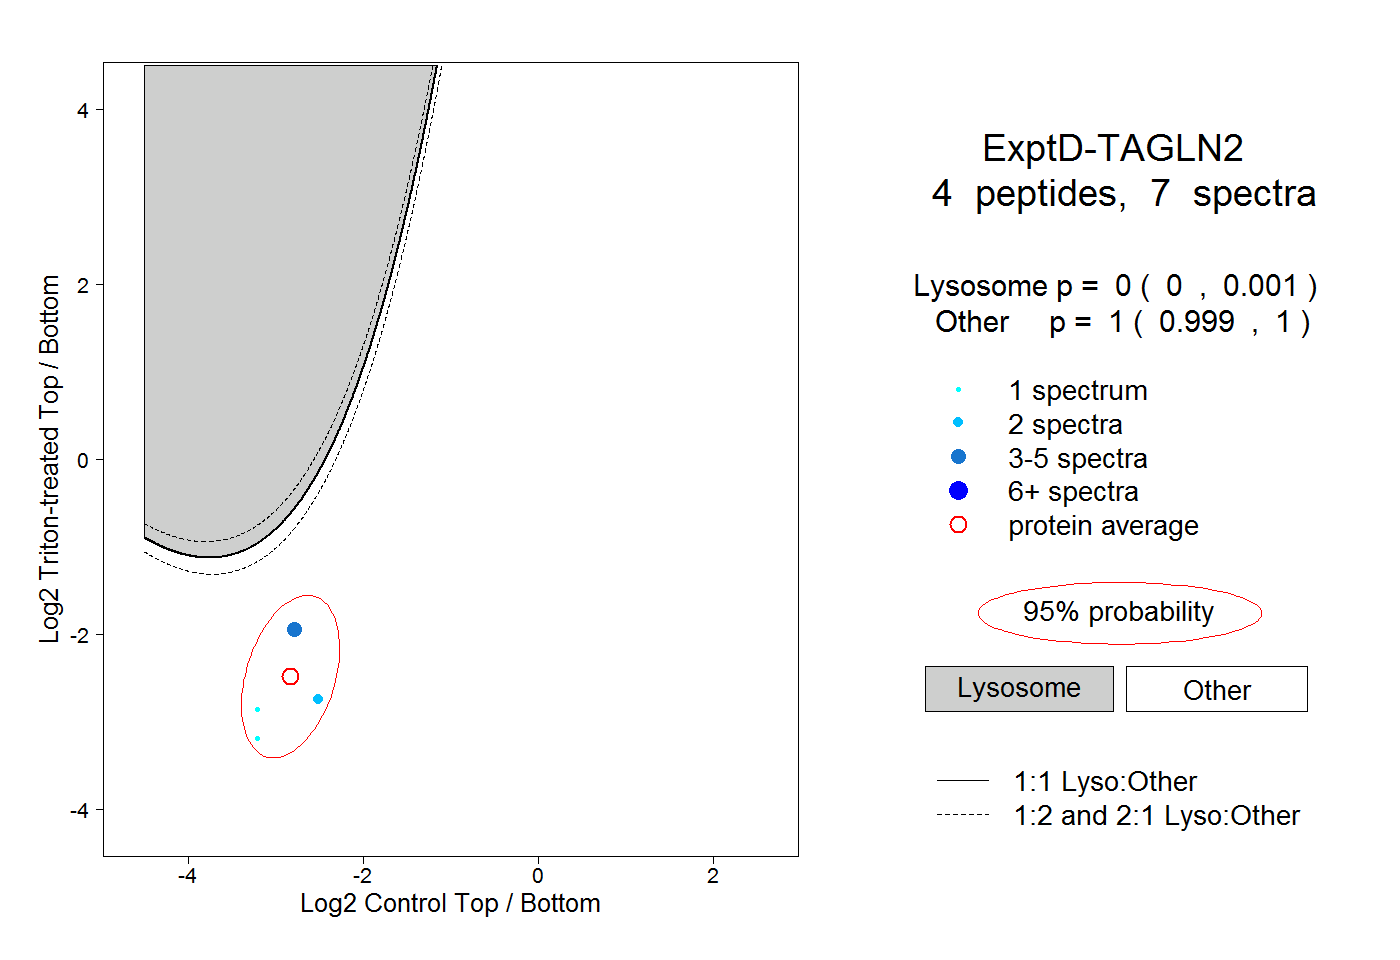 |
0.000 0.000 | 0.001 |
1.000 0.999 | 1.000 |