 18
18peptides
spectra
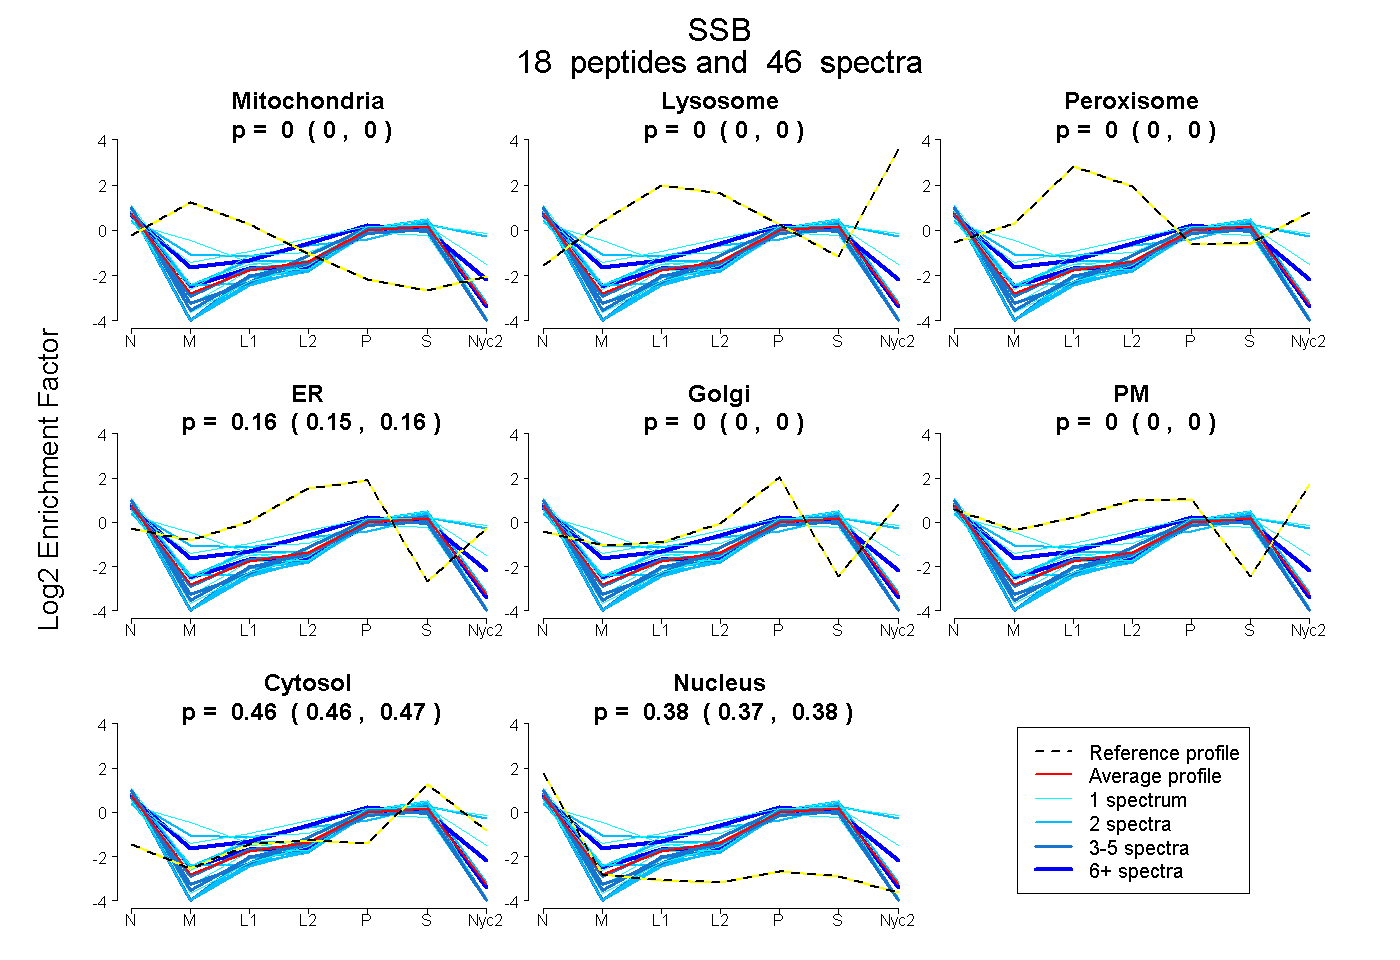
0.000 | 0.000
0.000 | 0.000
0.000 | 0.000
0.153 | 0.162
0.000 | 0.000
0.000 | 0.000
0.460 | 0.469
0.371 | 0.383
3peptides
spectra
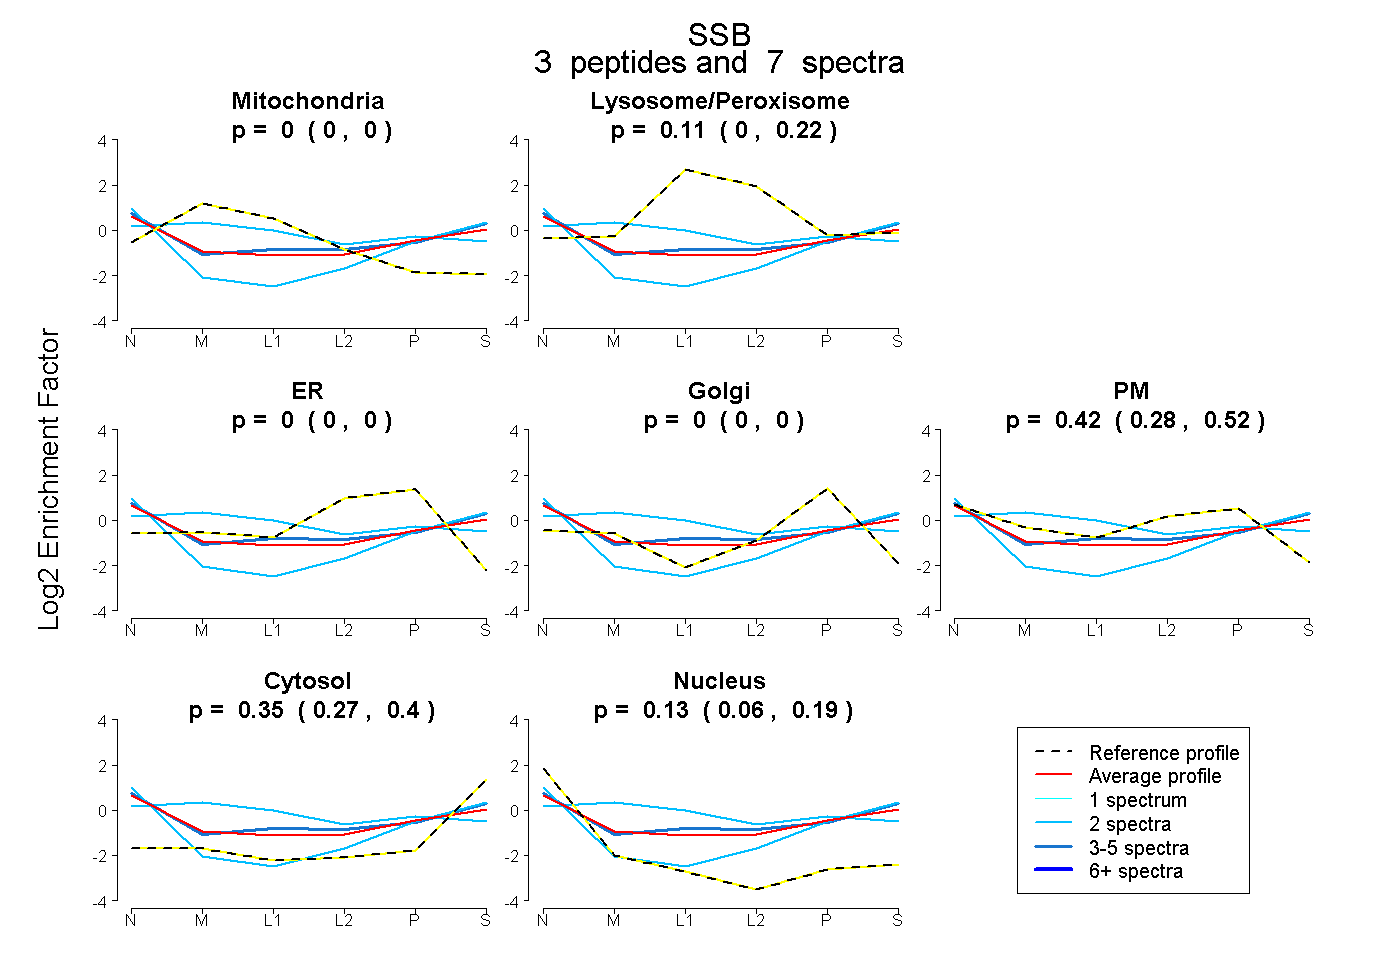
0.000 | 0.000
0.000 | 0.223
0.000 | 0.000
0.000 | 0.000
0.279 | 0.522
0.273 | 0.400
0.063 | 0.186
6peptides
spectra
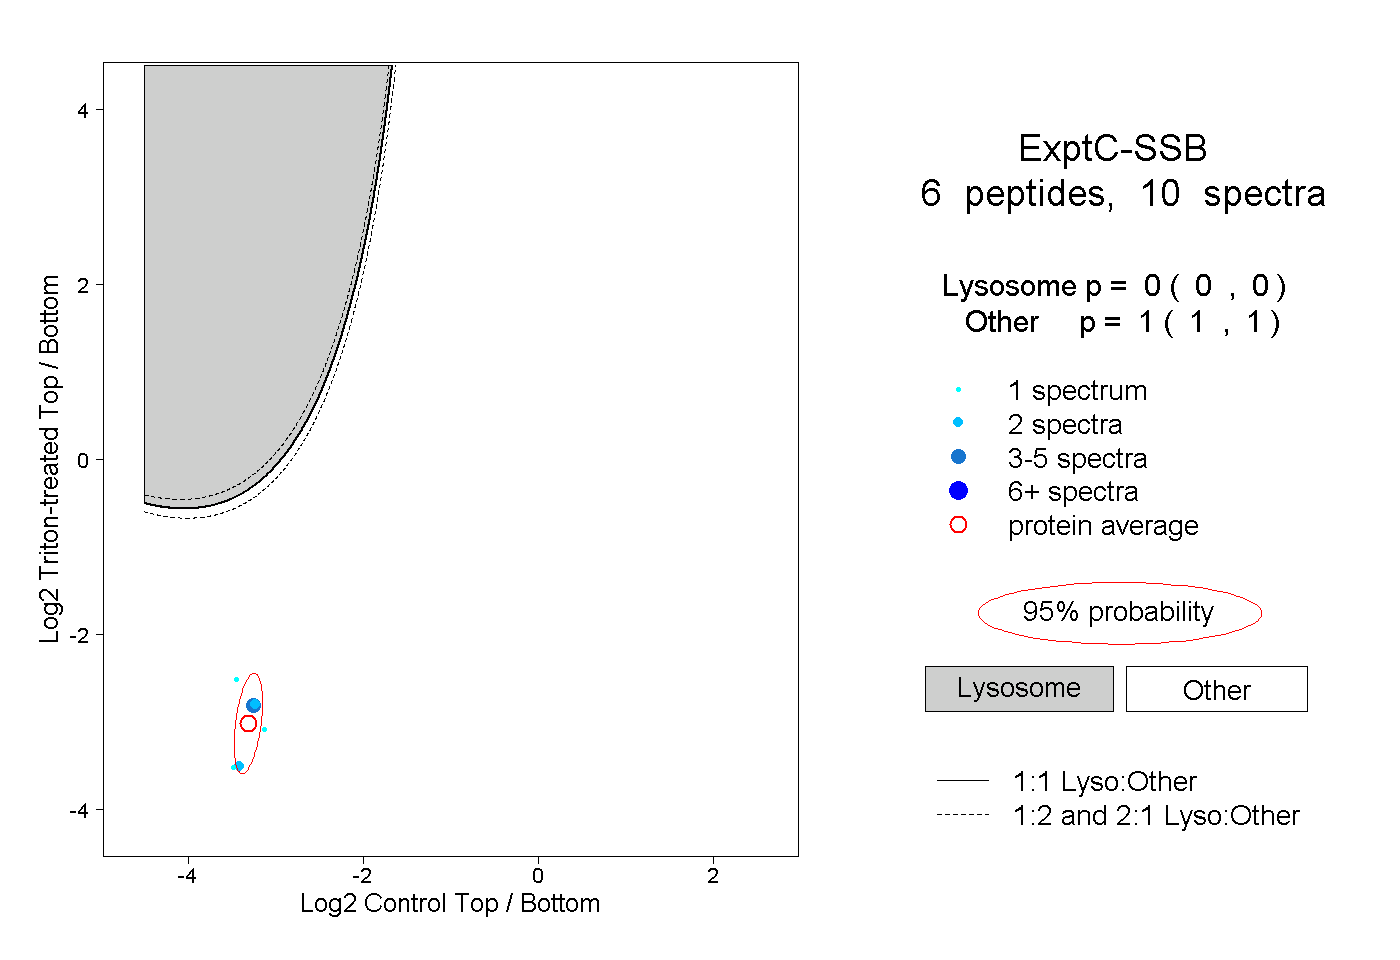
0.000 | 0.000
1.000 | 1.000