 18
18peptides
spectra
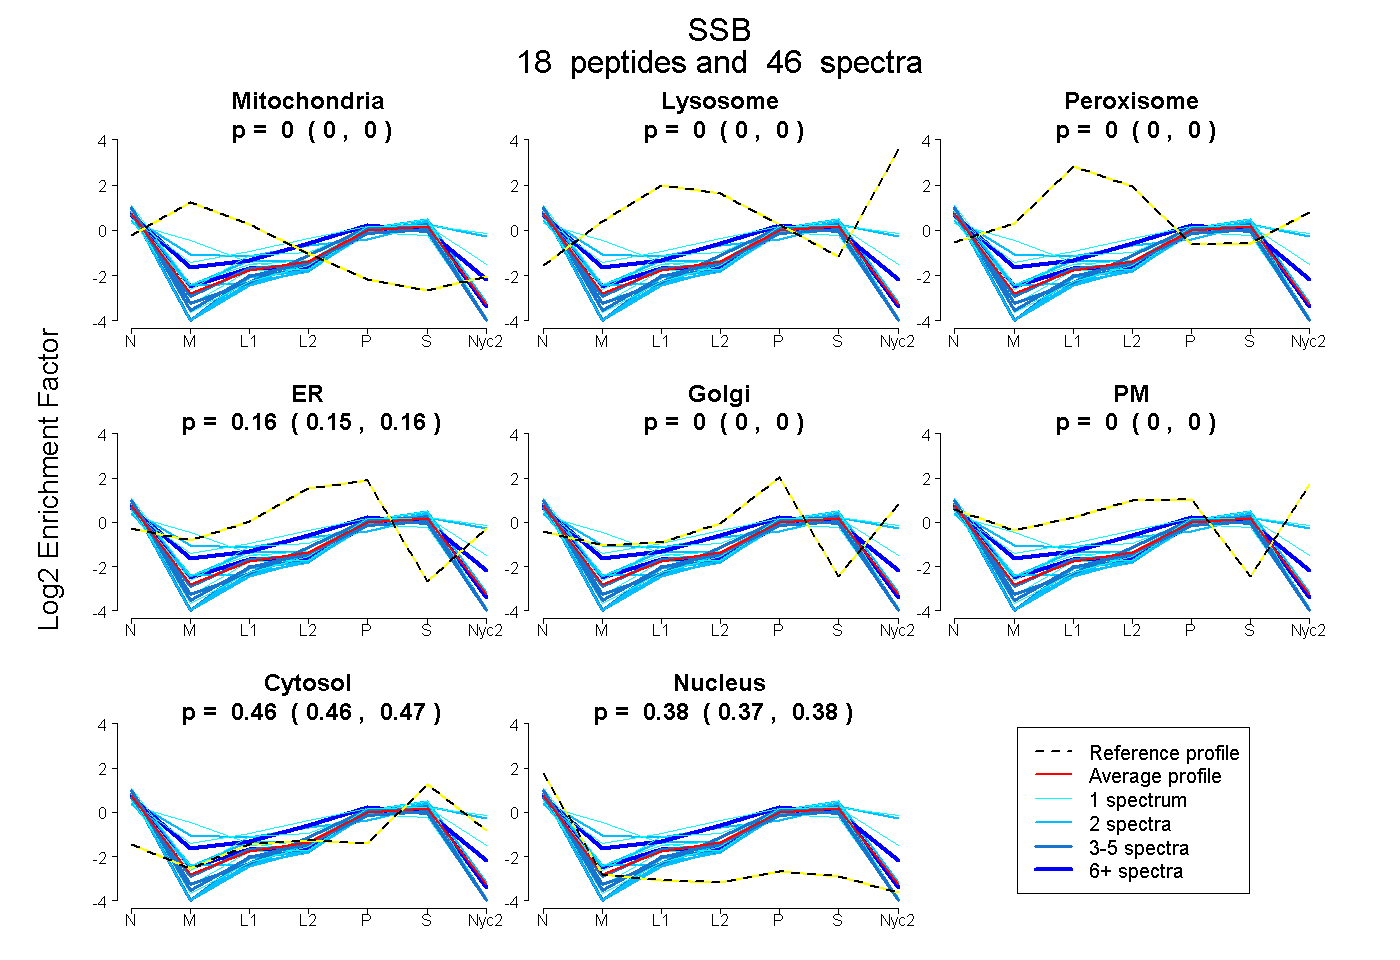
0.000 | 0.000
0.000 | 0.000
0.000 | 0.000
0.153 | 0.162
0.000 | 0.000
0.000 | 0.000
0.460 | 0.469
0.371 | 0.383
| Plot | Mito | Lyso | Perox | ER | Golgi | PM | Cytosol | Nucleus | |||||
| Expt A |
18 peptides |
46 spectra |
|
0.000 0.000 | 0.000 |
0.000 0.000 | 0.000 |
0.000 0.000 | 0.000 |
0.158 0.153 | 0.162 |
0.000 0.000 | 0.000 |
0.000 0.000 | 0.000 |
0.465 0.460 | 0.469 |
0.378 0.371 | 0.383 |
| 6 spectra, GSHVFTAAR | 0.000 | 0.000 | 0.000 | 0.348 | 0.000 | 0.000 | 0.423 | 0.229 | ||
| 4 spectra, SANNGNLLLR | 0.000 | 0.000 | 0.000 | 0.151 | 0.000 | 0.000 | 0.372 | 0.477 | ||
| 3 spectra, GNRPAYAGAPK | 0.000 | 0.000 | 0.000 | 0.049 | 0.000 | 0.000 | 0.481 | 0.470 | ||
| 2 spectra, FVDTPGQK | 0.000 | 0.000 | 0.000 | 0.139 | 0.000 | 0.000 | 0.391 | 0.470 | ||
| 1 spectrum, SPSRPLPEVTDEYK | 0.000 | 0.000 | 0.000 | 0.082 | 0.000 | 0.000 | 0.450 | 0.468 | ||
| 1 spectrum, MGCLLK | 0.000 | 0.000 | 0.000 | 0.069 | 0.000 | 0.000 | 0.521 | 0.409 | ||
| 3 spectra, LDEGWVPLETMIK | 0.000 | 0.000 | 0.000 | 0.130 | 0.000 | 0.000 | 0.448 | 0.421 | ||
| 5 spectra, WIDFVR | 0.000 | 0.000 | 0.000 | 0.098 | 0.000 | 0.000 | 0.415 | 0.486 | ||
| 1 spectrum, ITDDQQESLNK | 0.000 | 0.000 | 0.000 | 0.207 | 0.000 | 0.000 | 0.319 | 0.474 | ||
| 1 spectrum, DTNLLILFK | 0.276 | 0.000 | 0.000 | 0.068 | 0.000 | 0.000 | 0.385 | 0.271 | ||
| 2 spectra, ANLMEVSADK | 0.016 | 0.000 | 0.006 | 0.000 | 0.000 | 0.367 | 0.519 | 0.092 | ||
| 7 spectra, EDYFAK | 0.000 | 0.000 | 0.000 | 0.147 | 0.000 | 0.000 | 0.457 | 0.396 | ||
| 1 spectrum, HKPGSTETR | 0.000 | 0.000 | 0.000 | 0.271 | 0.000 | 0.000 | 0.527 | 0.202 | ||
| 2 spectra, EGIILFK | 0.000 | 0.000 | 0.000 | 0.018 | 0.000 | 0.000 | 0.499 | 0.483 | ||
| 2 spectra, GSIFAVFDSIQSAK | 0.000 | 0.000 | 0.000 | 0.019 | 0.000 | 0.000 | 0.511 | 0.470 | ||
| 1 spectrum, ICHQIEYYFGDFNLPR | 0.000 | 0.000 | 0.000 | 0.011 | 0.000 | 0.422 | 0.520 | 0.047 | ||
| 2 spectra, FDDDDHR | 0.000 | 0.000 | 0.000 | 0.029 | 0.000 | 0.000 | 0.487 | 0.484 | ||
| 2 spectra, GQILNIQMR | 0.000 | 0.000 | 0.000 | 0.172 | 0.000 | 0.000 | 0.535 | 0.293 |
| Plot | Mito | Lyso or Perox | ER | Golgi | PM | Cytosol | Nucleus | ||||||
| Expt B |
3 peptides |
7 spectra |
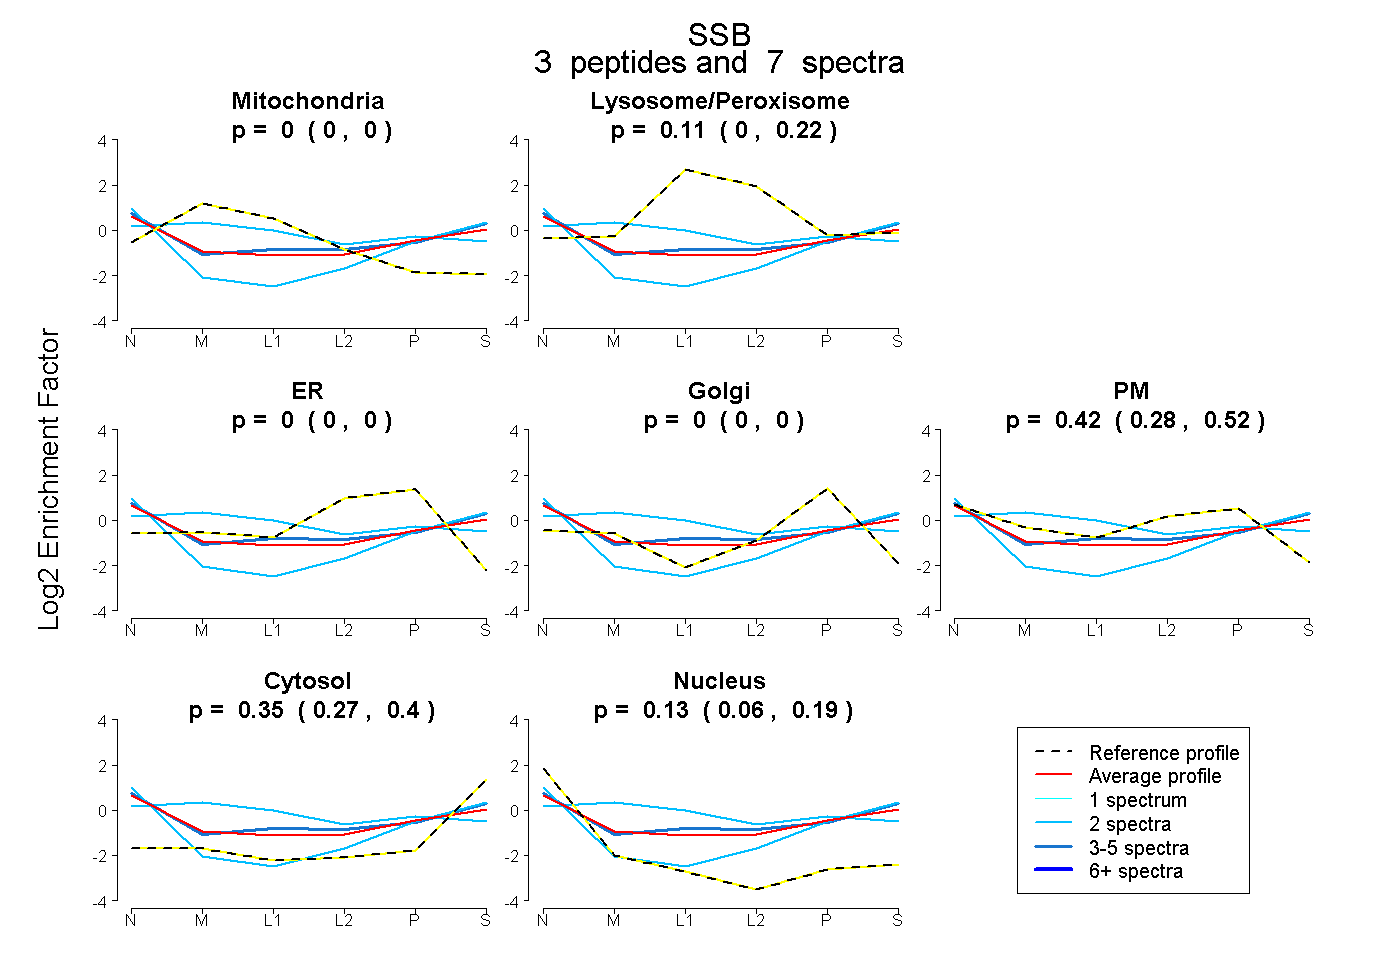 |
0.000 0.000 | 0.000 |
0.110 0.000 | 0.223 |
0.000 0.000 | 0.000 |
0.000 0.000 | 0.000 |
0.417 0.279 | 0.522 |
0.346 0.273 | 0.400 |
0.128 0.063 | 0.186 |
|||
| Plot | Lyso | Other | |||||||||||
| Expt C |
6 peptides |
10 spectra |
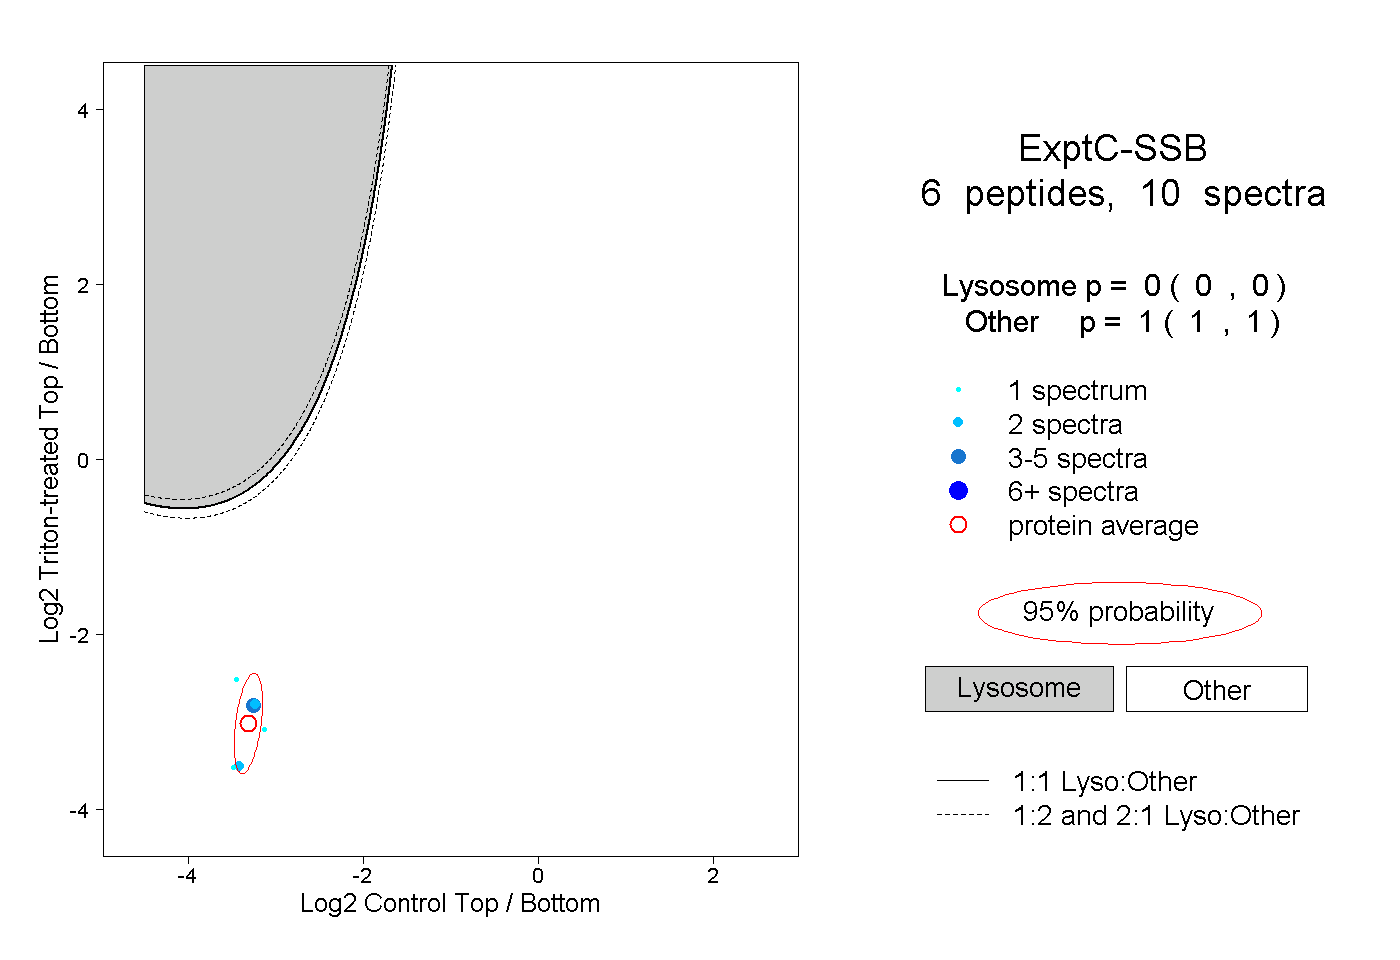 |
0.000 0.000 | 0.000 |
1.000 1.000 | 1.000 |