 24
24peptides
spectra
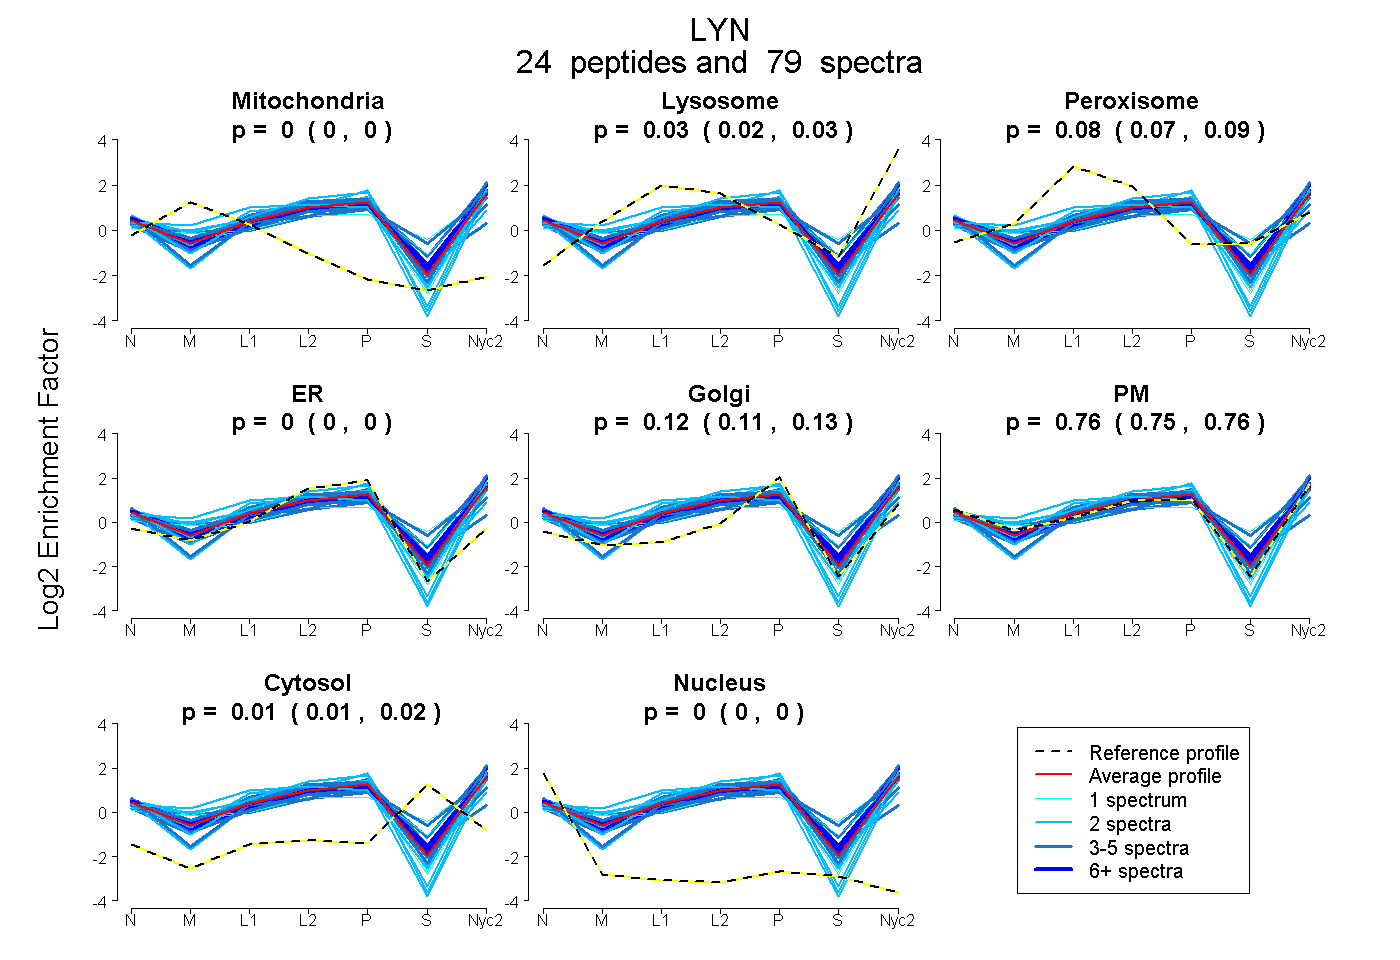
0.000 | 0.000
0.023 | 0.034
0.074 | 0.088
0.000 | 0.005
0.111 | 0.127
0.748 | 0.763
0.009 | 0.016
0.000 | 0.000
9peptides
spectra
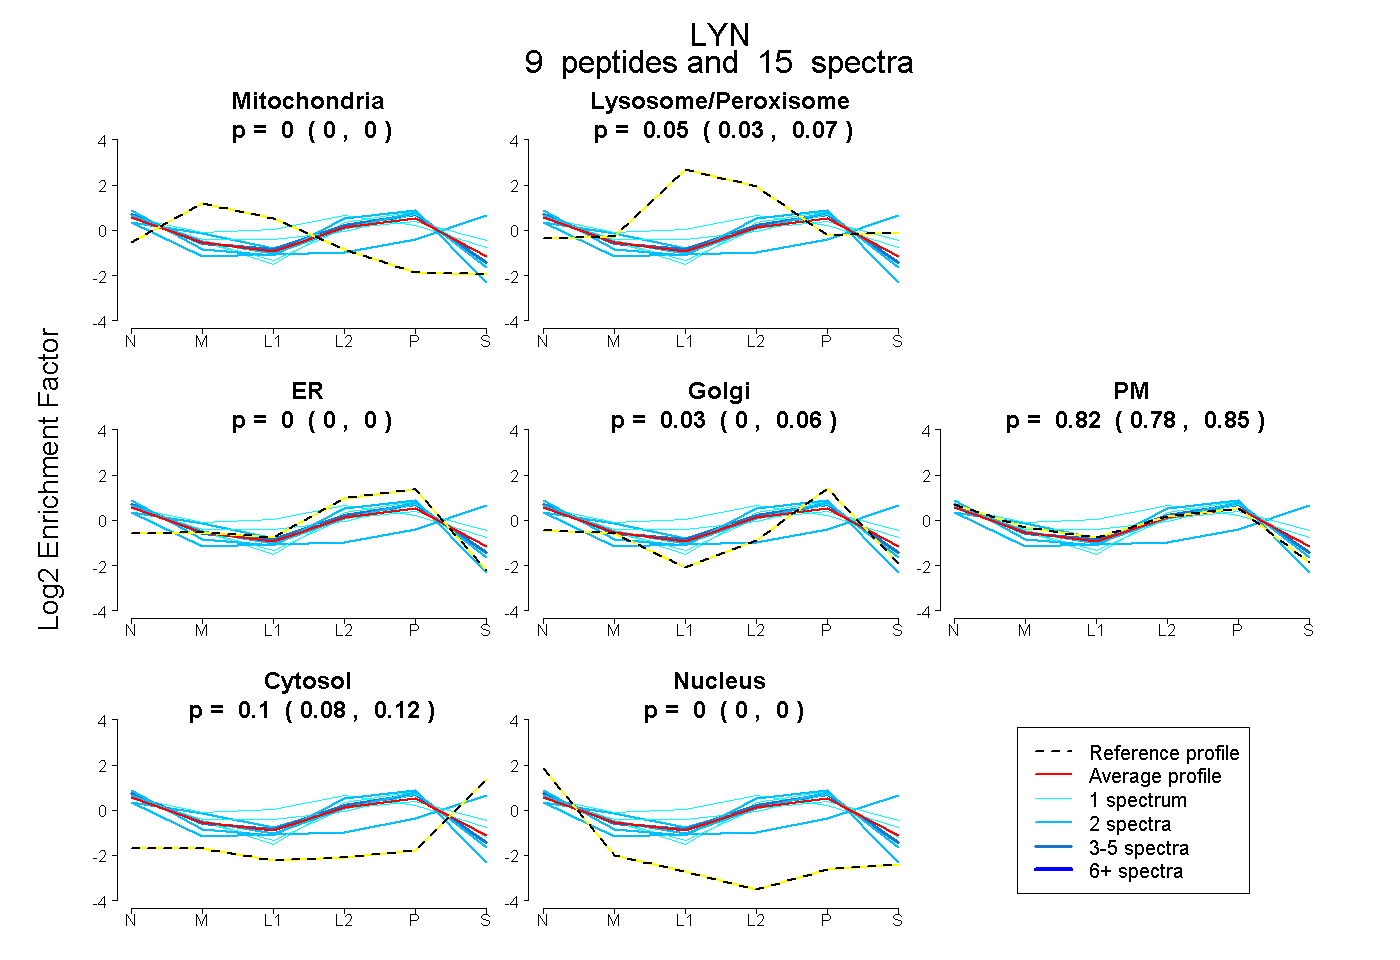
0.000 | 0.000
0.027 | 0.066
0.000 | 0.000
0.000 | 0.062
0.776 | 0.853
0.081 | 0.116
0.000 | 0.000
24peptides
spectra
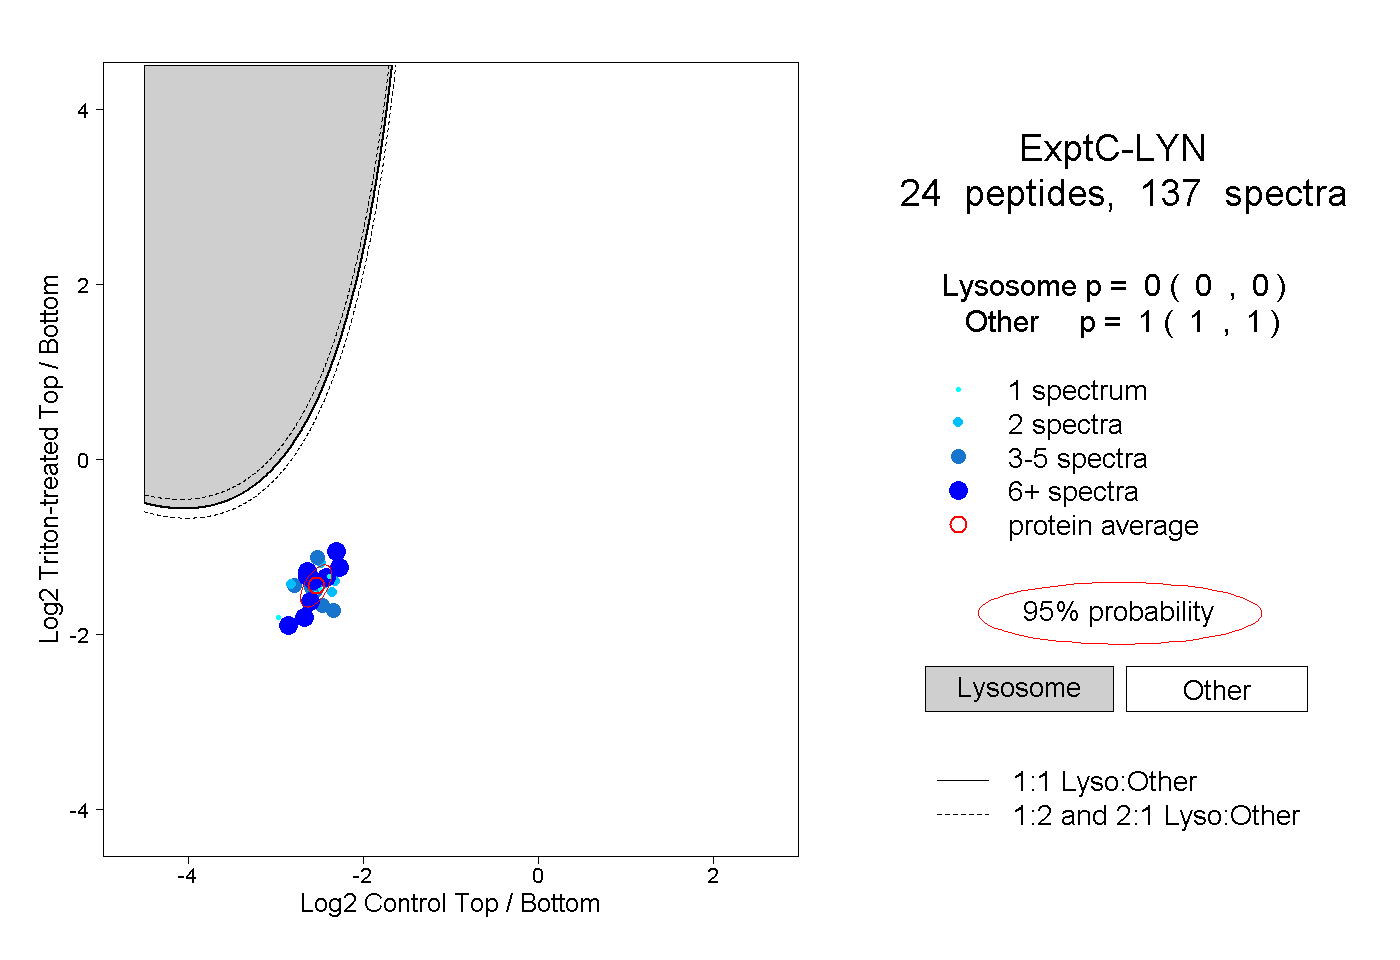
0.000 | 0.000
1.000 | 1.000
5peptides
spectra
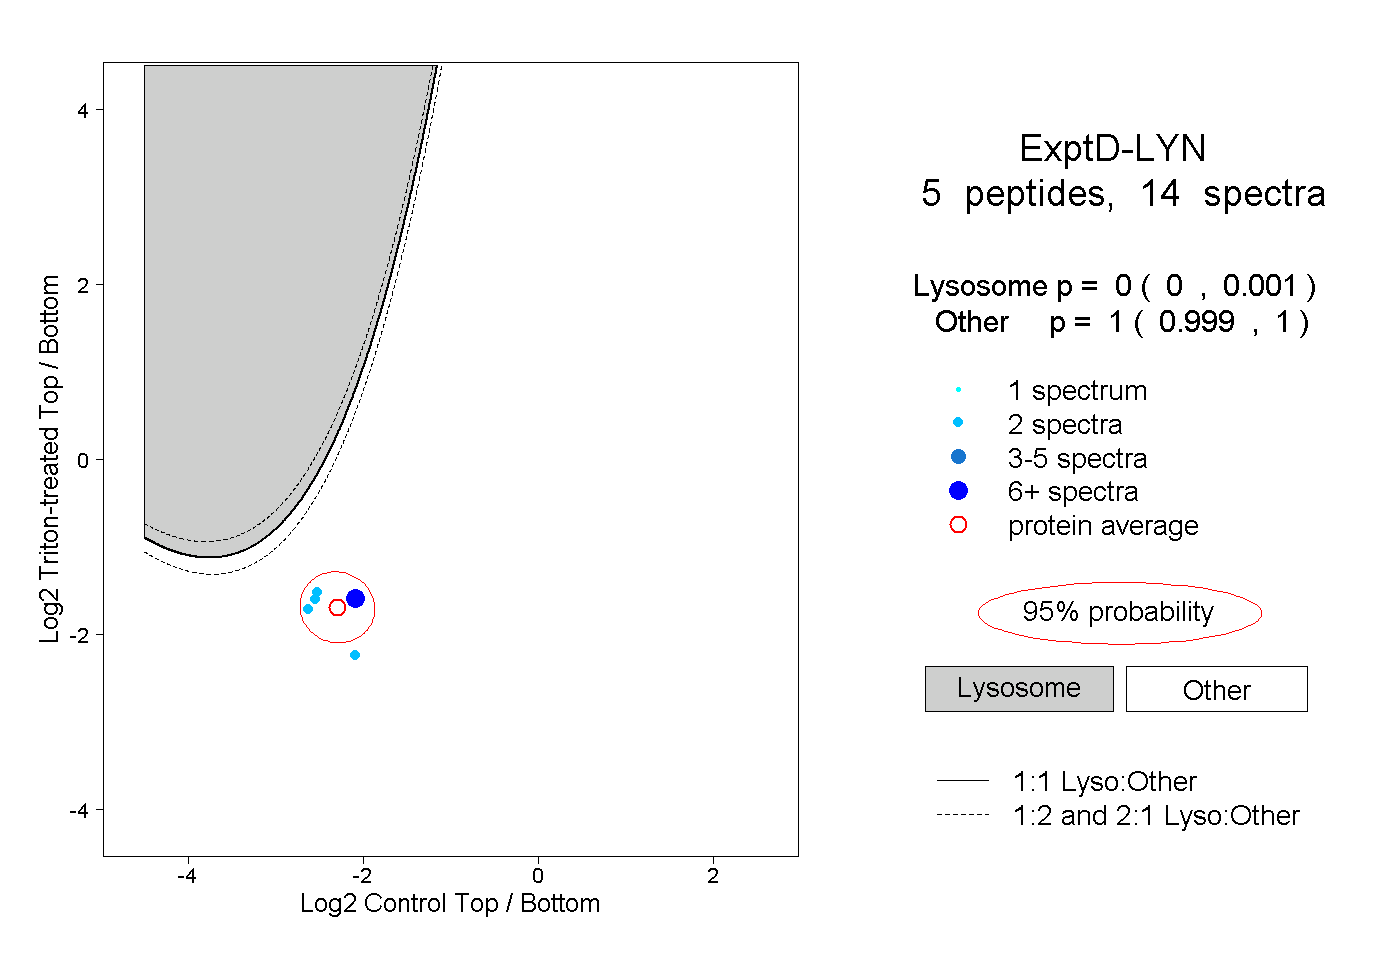
0.000 | 0.001
0.999 | 1.000