 4
4peptides
spectra
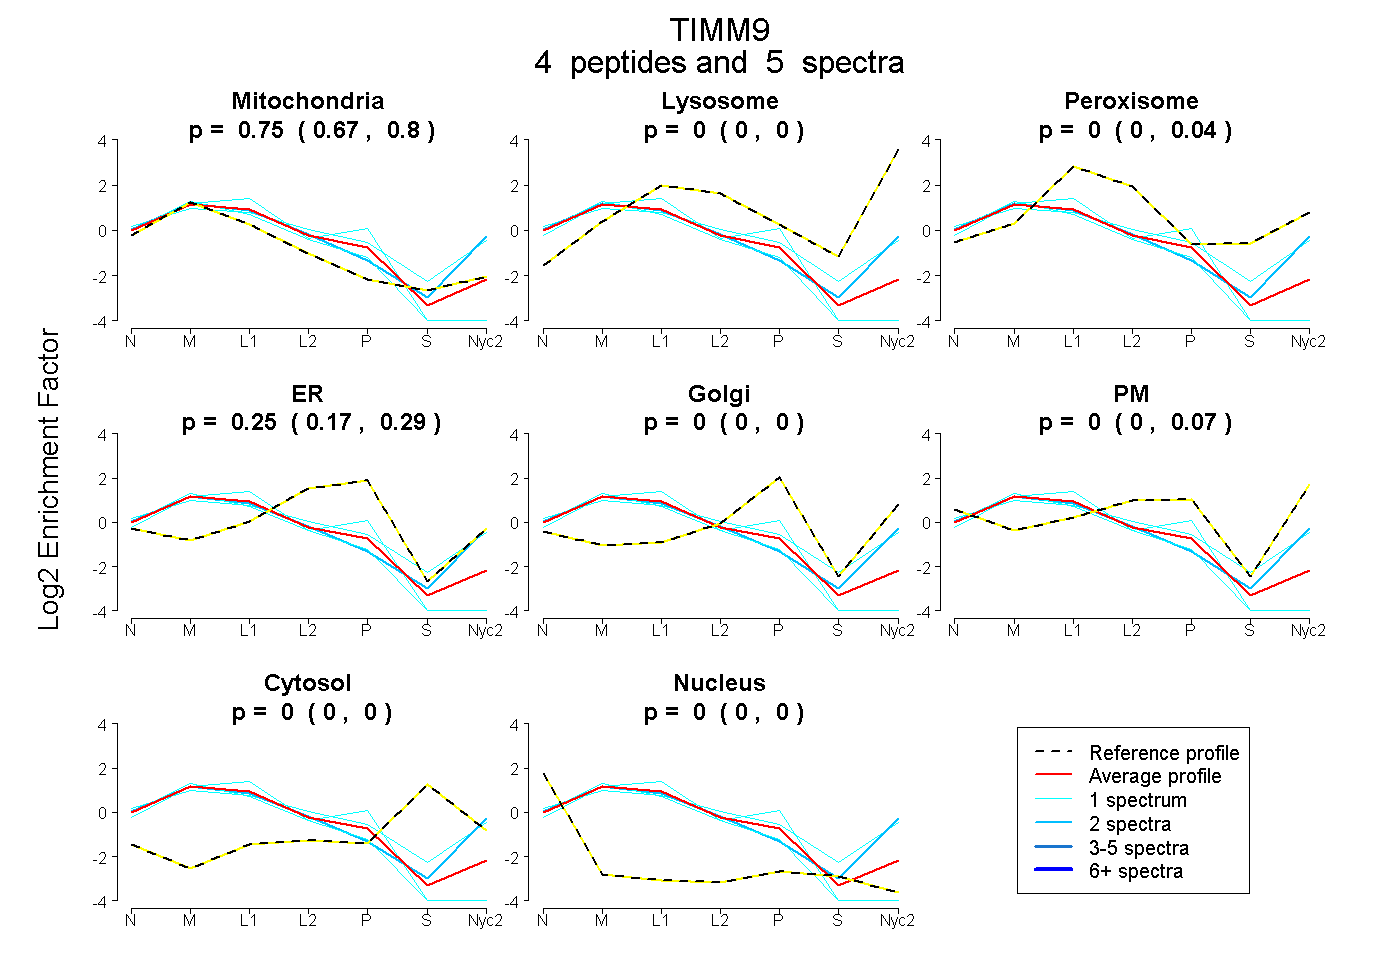
0.668 | 0.803
0.000 | 0.000
0.000 | 0.044
0.167 | 0.292
0.000 | 0.000
0.000 | 0.067
0.000 | 0.000
0.000 | 0.000
2peptides
spectra
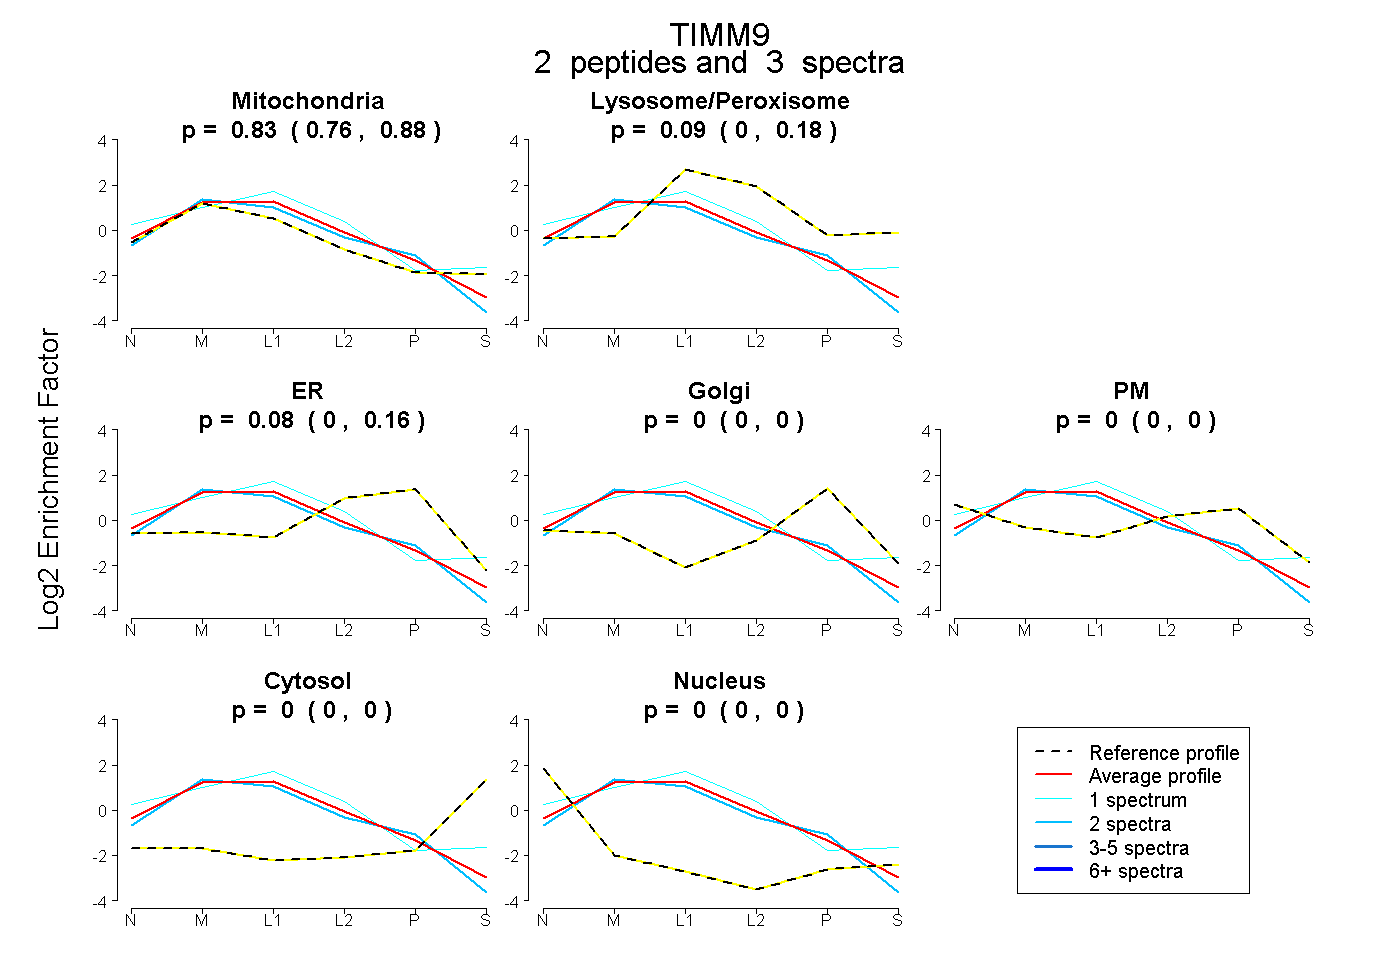
0.756 | 0.883
0.000 | 0.179
0.000 | 0.158
0.000 | 0.000
0.000 | 0.000
0.000 | 0.000
0.000 | 0.000
4peptides
spectra
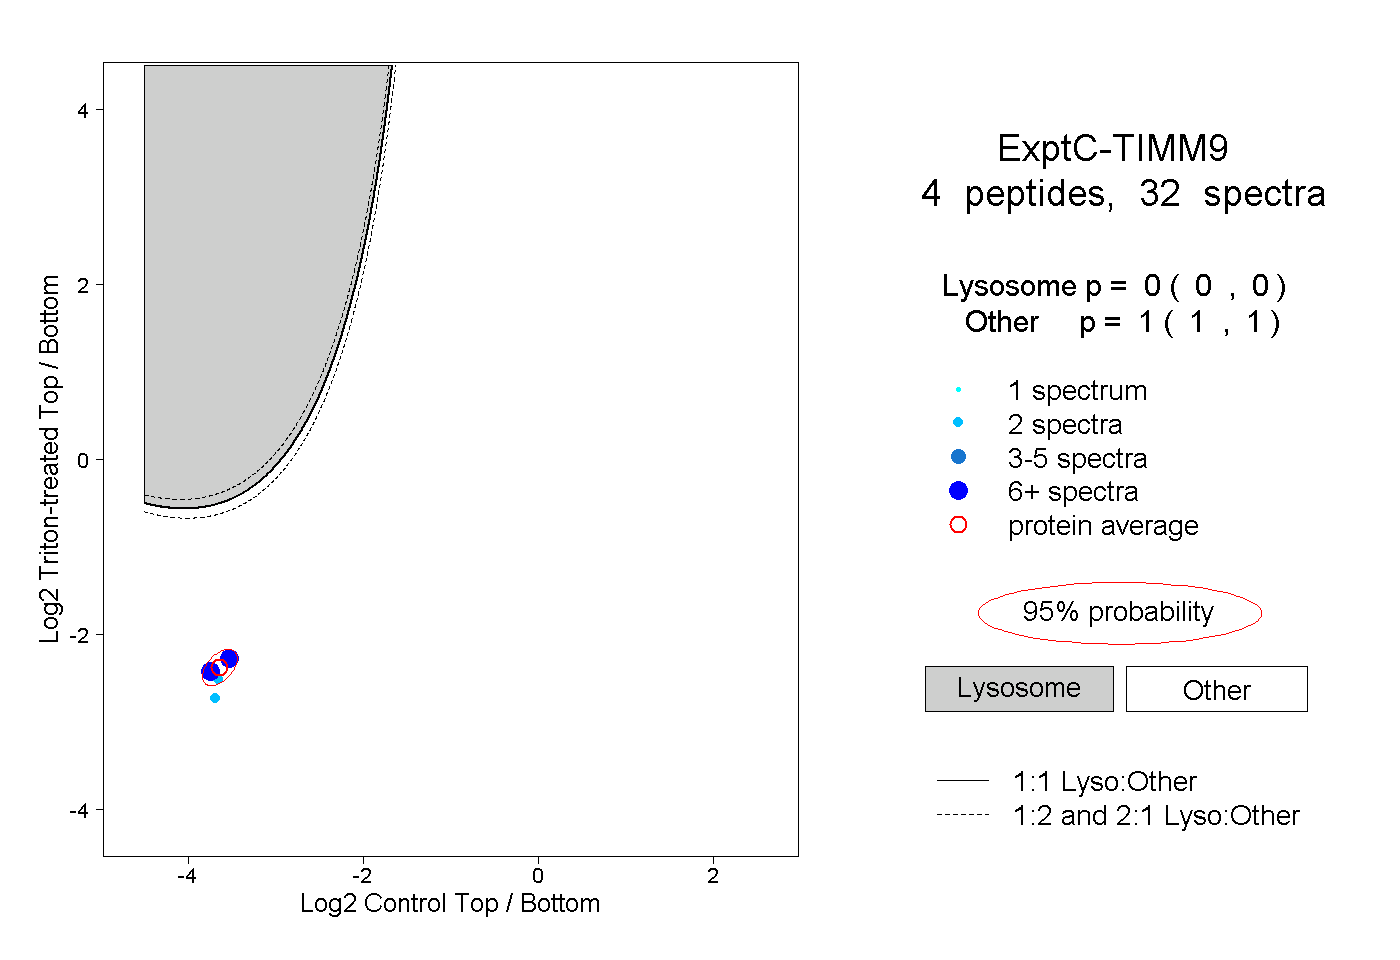
0.000 | 0.000
1.000 | 1.000
1peptide
spectra
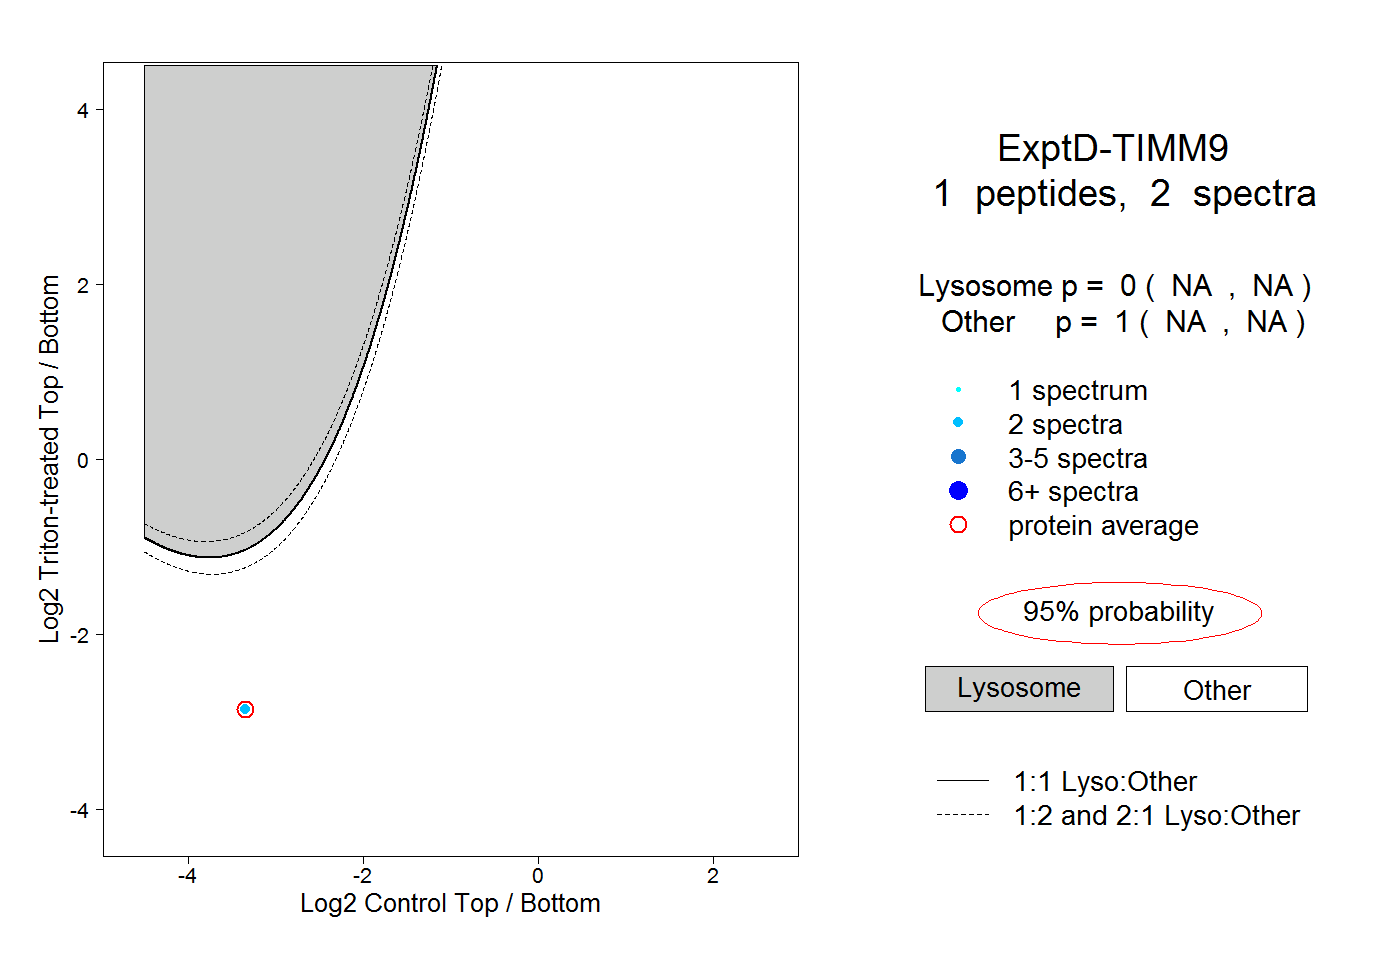
NA | NA
NA | NA