 4
4peptides
spectra
0.668 | 0.803
0.000 | 0.000
0.000 | 0.044
0.167 | 0.292
0.000 | 0.000
0.000 | 0.067
0.000 | 0.000
0.000 | 0.000
| Plot | Mito | Lyso | Perox | ER | Golgi | PM | Cytosol | Nucleus | |||||
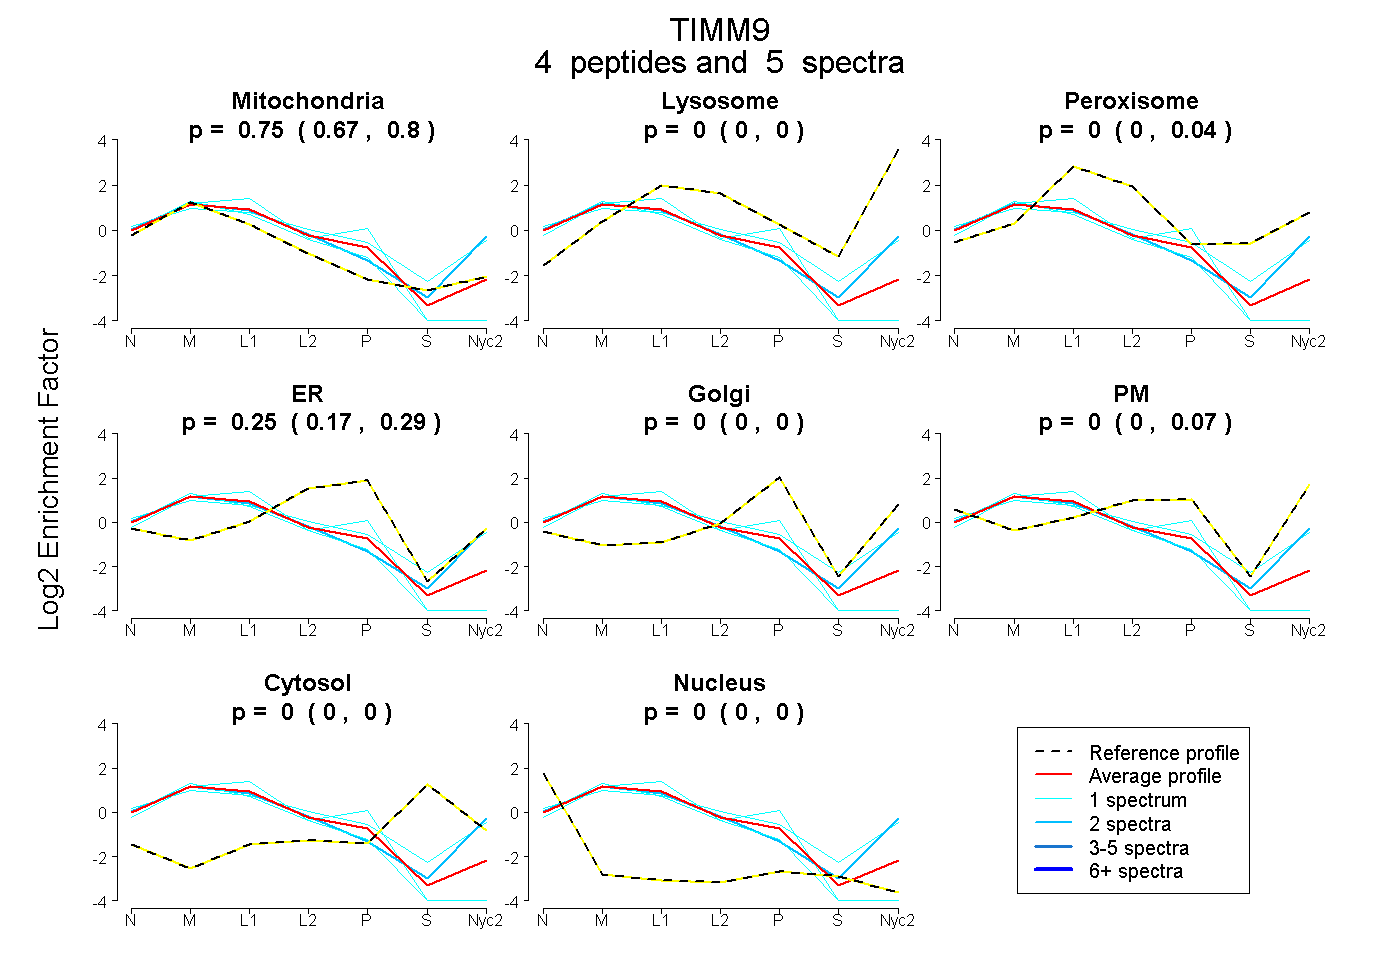
| Expt A |
4 peptides |
5 spectra |
|
0.749 0.668 | 0.803 |
0.000 0.000 | 0.000 |
0.000 0.000 | 0.044 |
0.251 0.167 | 0.292 |
0.000 0.000 | 0.000 |
0.000 0.000 | 0.067 |
0.000 0.000 | 0.000 |
0.000 0.000 | 0.000 |
| 1 spectrum, LTETCFLDCVK | 0.757 | 0.000 | 0.000 | 0.243 | 0.000 | 0.000 | 0.000 | 0.000 | ||
| 1 spectrum, AGLLGQPR | 0.511 | 0.000 | 0.149 | 0.011 | 0.000 | 0.328 | 0.000 | 0.000 | ||
| 1 spectrum, EVKPEEVTCSEHCLQK | 0.919 | 0.000 | 0.000 | 0.066 | 0.000 | 0.000 | 0.000 | 0.015 | ||
| 2 spectra, EFLGTYNK | 0.659 | 0.147 | 0.000 | 0.000 | 0.000 | 0.194 | 0.000 | 0.000 |
| Plot | Mito | Lyso or Perox | ER | Golgi | PM | Cytosol | Nucleus | ||||||
| Expt B |
2 peptides |
3 spectra |
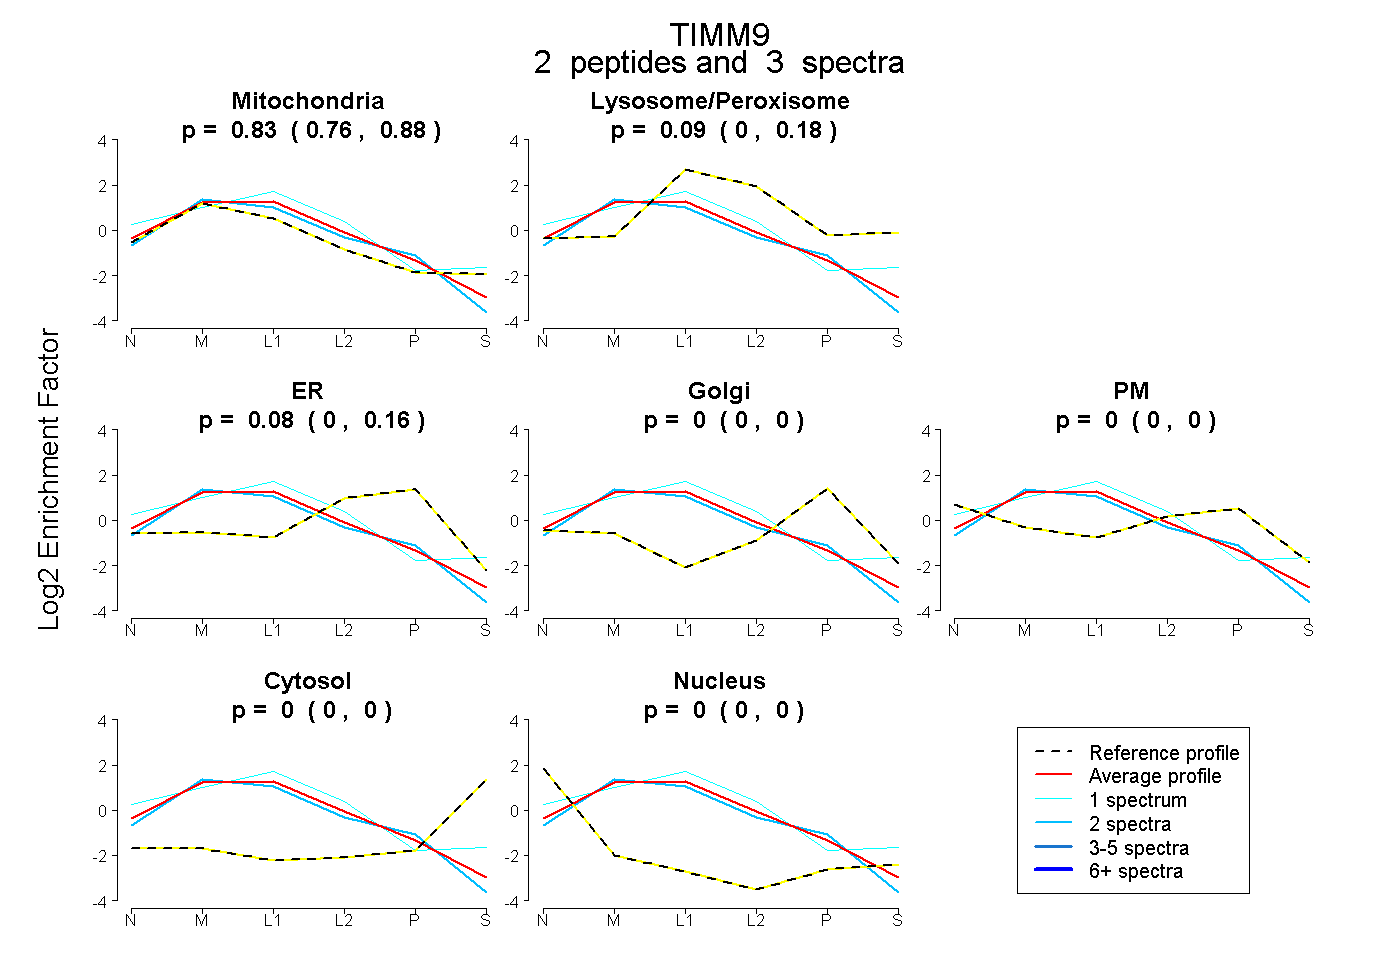 |
0.829 0.756 | 0.883 |
0.090 0.000 | 0.179 |
0.082 0.000 | 0.158 |
0.000 0.000 | 0.000 |
0.000 0.000 | 0.000 |
0.000 0.000 | 0.000 |
0.000 0.000 | 0.000 |
|||
| Plot | Lyso | Other | |||||||||||
| Expt C |
4 peptides |
32 spectra |
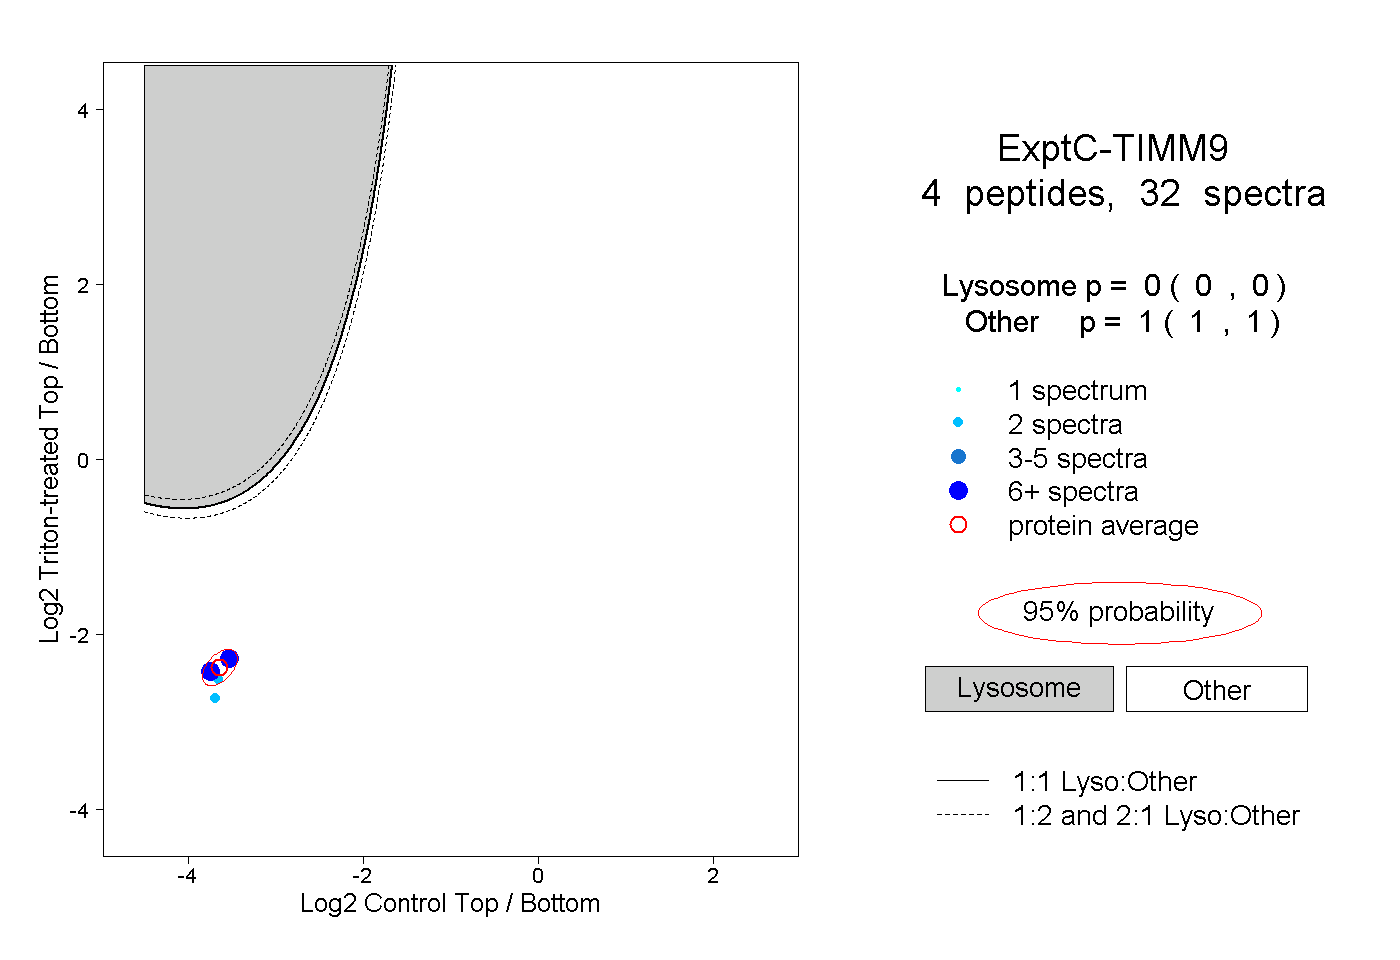 |
0.000 0.000 | 0.000 |
1.000 1.000 | 1.000 |
||||||||
| Plot | Lyso | Other | |||||||||||
| Expt D |
1 peptide |
2 spectra |
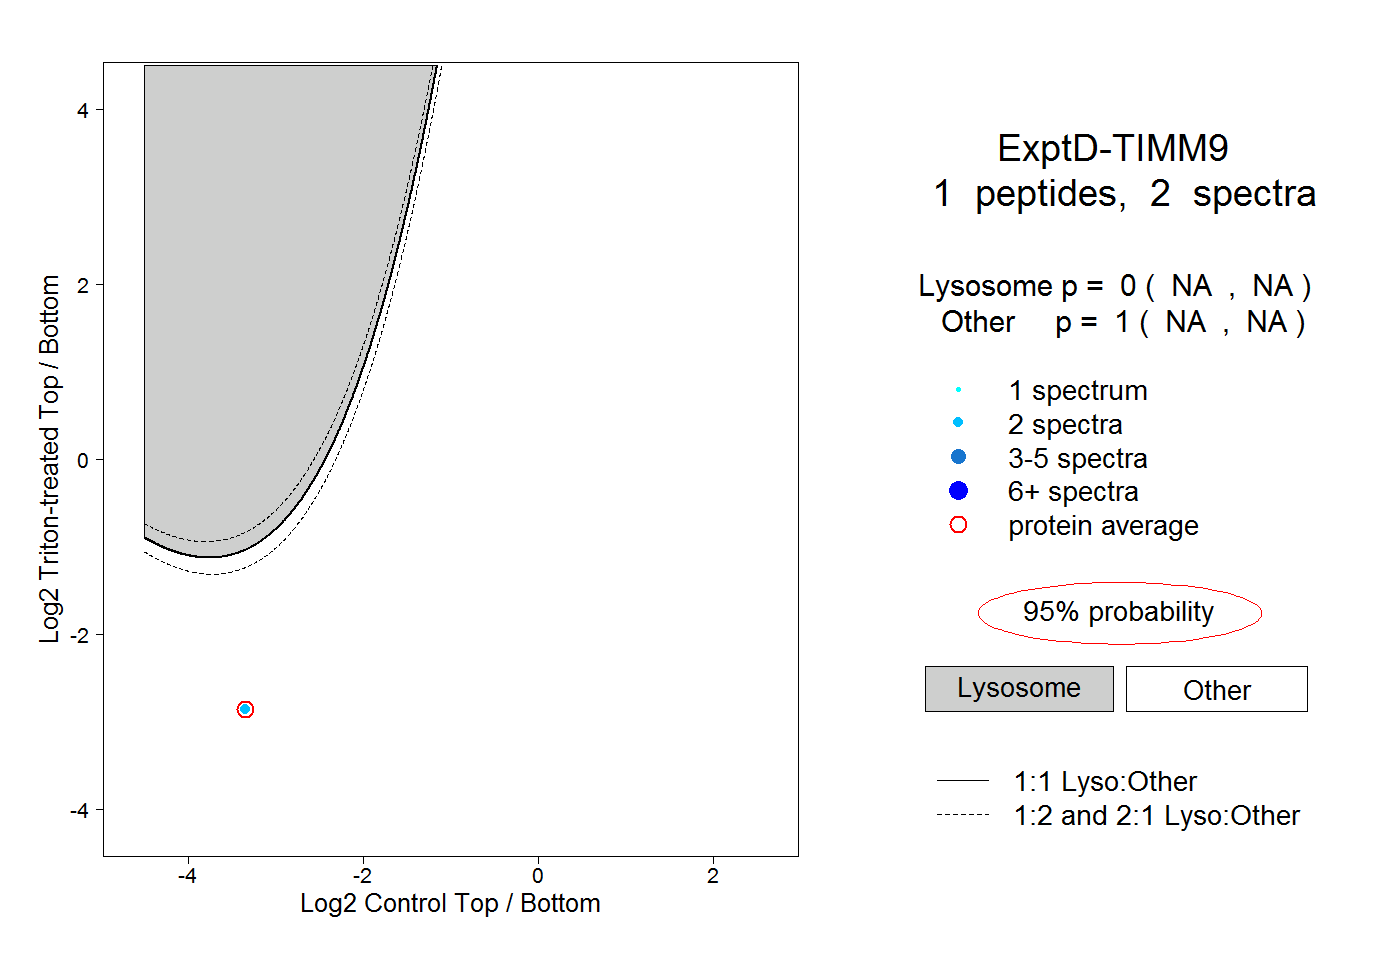 |
0.000 NA | NA |
1.000 NA | NA |