 5
5peptides
spectra
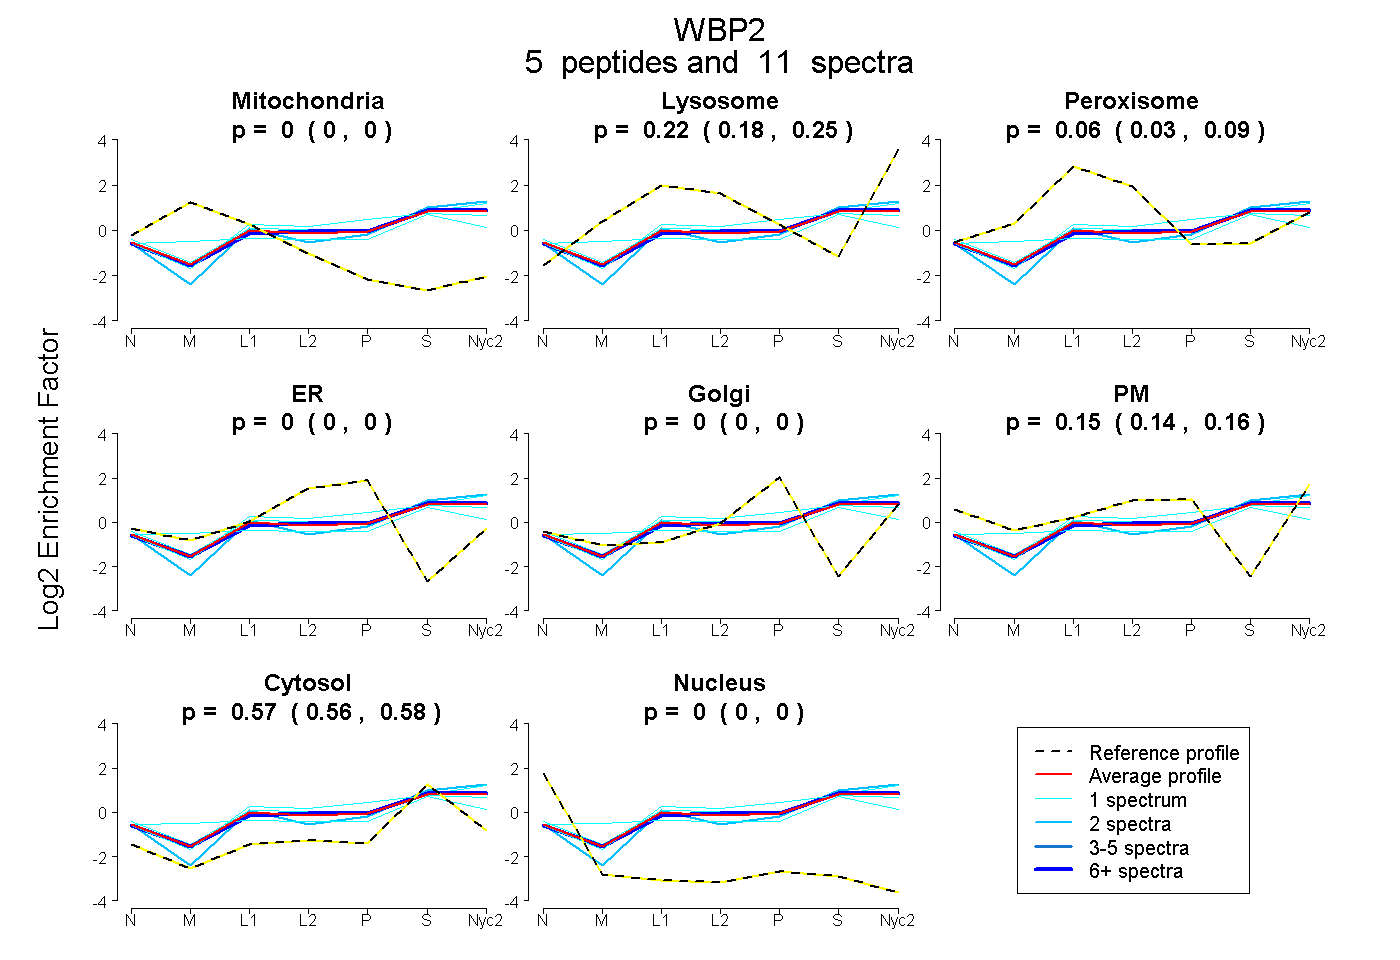
0.000 | 0.000
0.180 | 0.245
0.031 | 0.091
0.000 | 0.000
0.000 | 0.000
0.137 | 0.163
0.555 | 0.580
0.000 | 0.000
1peptide
spectrum
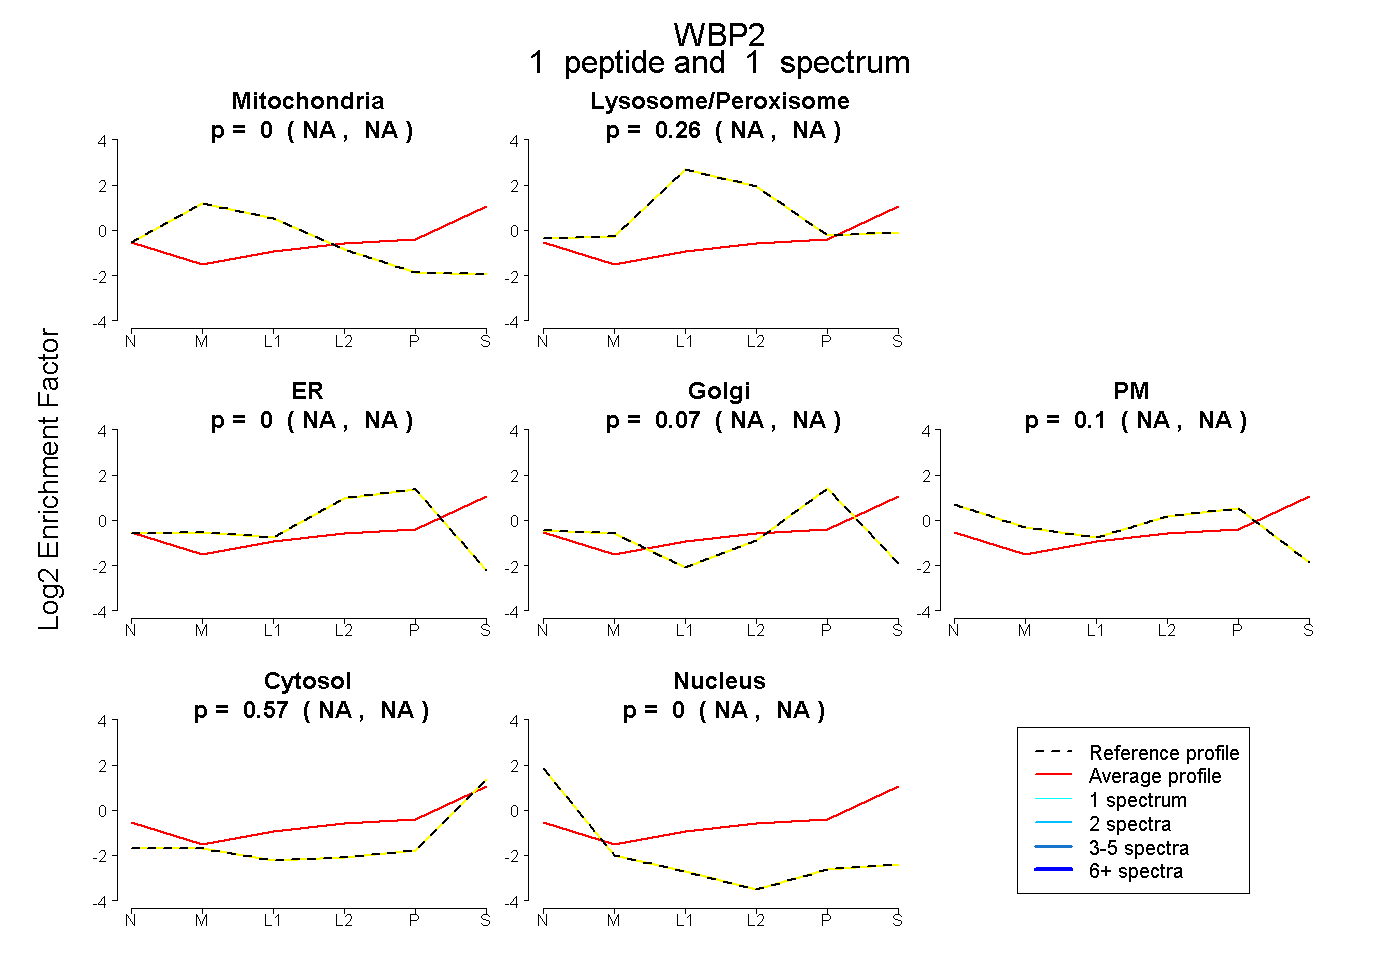
NA | NA
NA | NA
NA | NA
NA | NA
NA | NA
NA | NA
NA | NA
5peptides
spectra
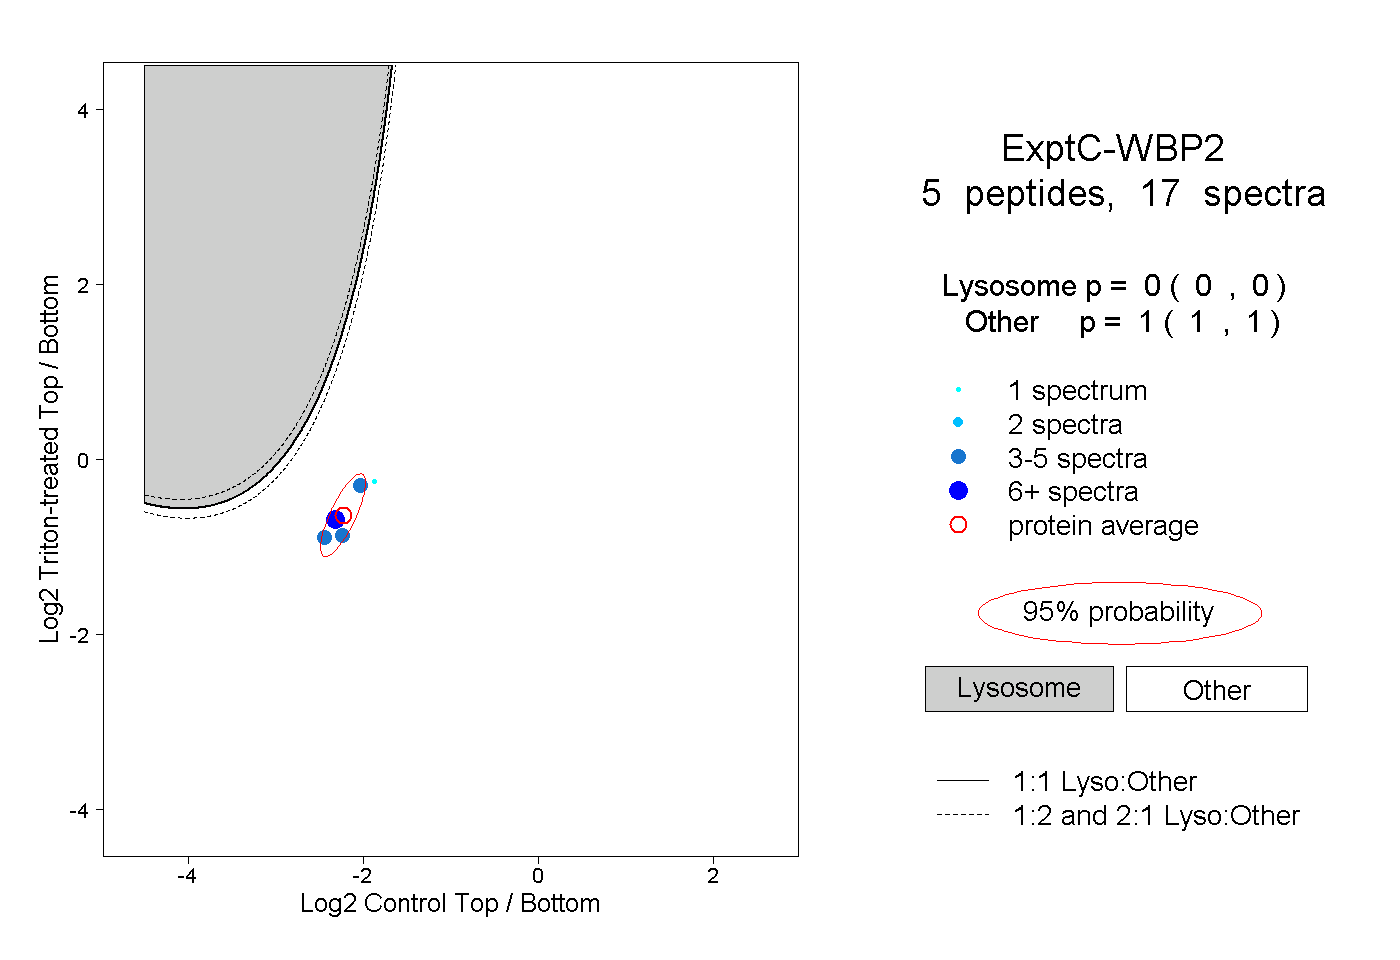
0.000 | 0.000
1.000 | 1.000
1peptide
spectrum
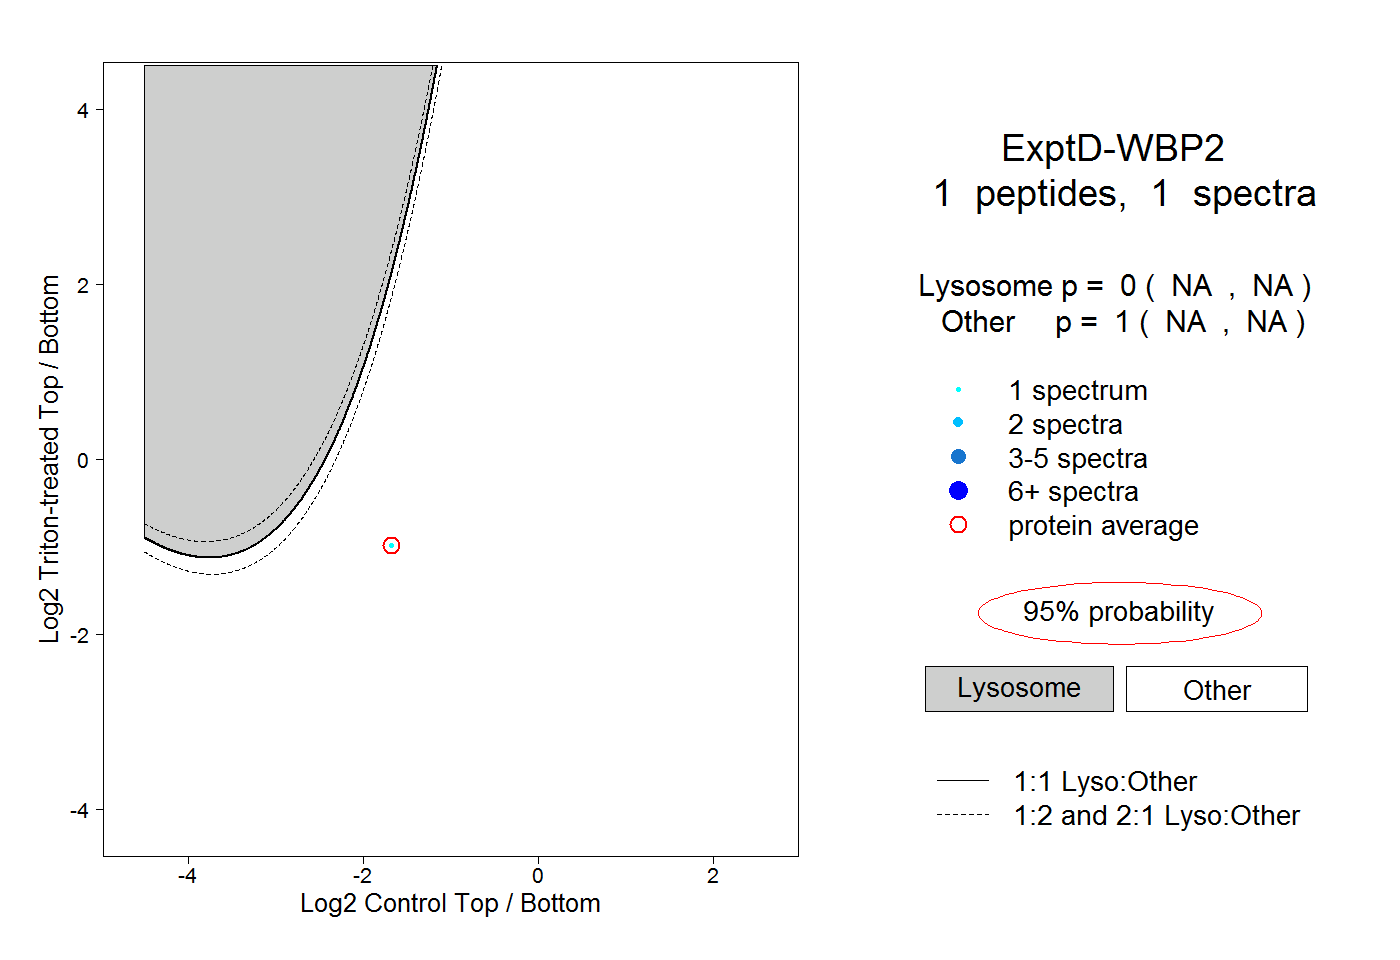
NA | NA
NA | NA