 5
5peptides
spectra
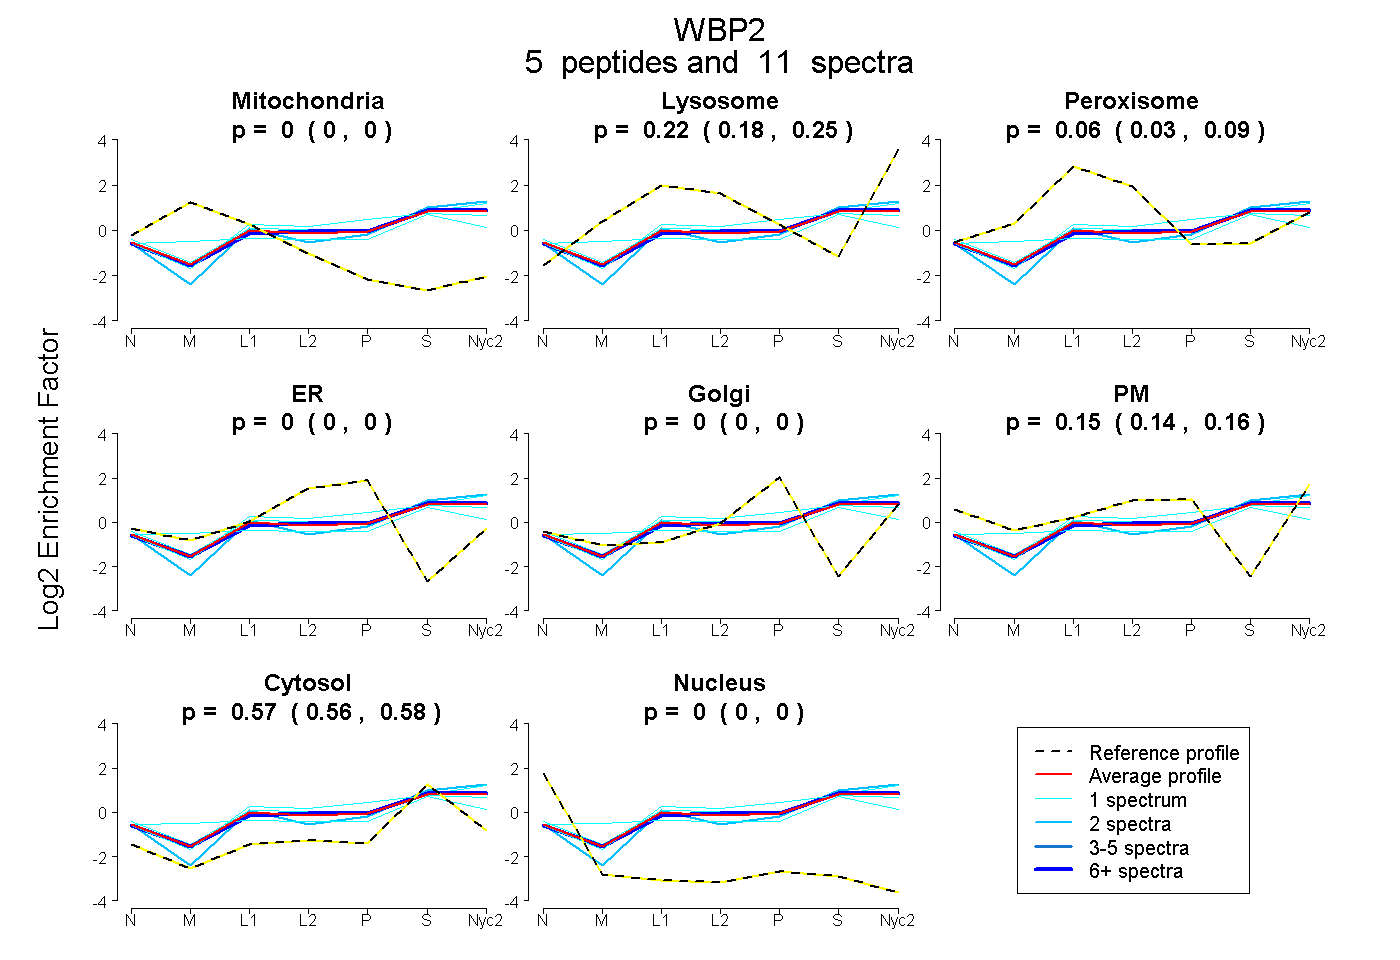
0.000 | 0.000
0.180 | 0.245
0.031 | 0.091
0.000 | 0.000
0.000 | 0.000
0.137 | 0.163
0.555 | 0.580
0.000 | 0.000
| Plot | Mito | Lyso | Perox | ER | Golgi | PM | Cytosol | Nucleus | |||||
| Expt A |
5 peptides |
11 spectra |
|
0.000 0.000 | 0.000 |
0.217 0.180 | 0.245 |
0.064 0.031 | 0.091 |
0.000 0.000 | 0.000 |
0.000 0.000 | 0.000 |
0.151 0.137 | 0.163 |
0.569 0.555 | 0.580 |
0.000 0.000 | 0.000 |
| 1 spectrum, QPVFGANFIK | 0.000 | 0.149 | 0.204 | 0.000 | 0.182 | 0.000 | 0.464 | 0.000 | ||
| 6 spectra, MLQVASQASR | 0.000 | 0.231 | 0.044 | 0.000 | 0.000 | 0.151 | 0.575 | 0.000 | ||
| 1 spectrum, NVPEAFK | 0.053 | 0.084 | 0.153 | 0.000 | 0.000 | 0.155 | 0.555 | 0.000 | ||
| 1 spectrum, LTFTAGGAIEFGQR | 0.000 | 0.287 | 0.044 | 0.000 | 0.000 | 0.144 | 0.525 | 0.000 | ||
| 2 spectra, GTVYLTPYR | 0.000 | 0.287 | 0.000 | 0.000 | 0.000 | 0.077 | 0.637 | 0.000 |
| Plot | Mito | Lyso or Perox | ER | Golgi | PM | Cytosol | Nucleus | ||||||
| Expt B |
1 peptide |
1 spectrum |
 |
0.000 NA | NA |
0.259 NA | NA |
0.000 NA | NA |
0.072 NA | NA |
0.095 NA | NA |
0.574 NA | NA |
0.000 NA | NA |
|||
| Plot | Lyso | Other | |||||||||||
| Expt C |
5 peptides |
17 spectra |
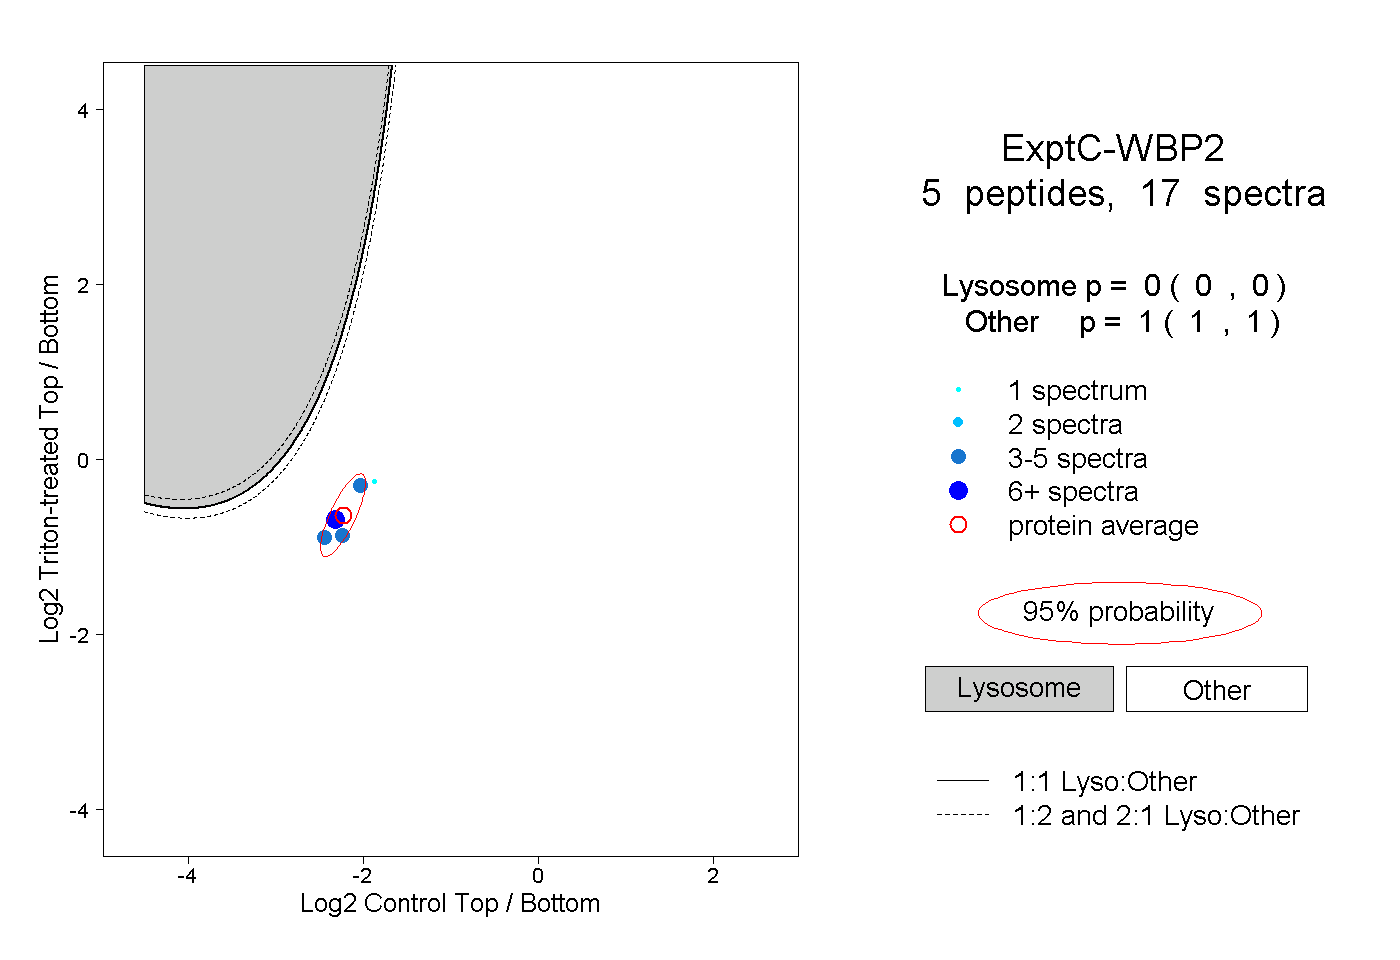 |
0.000 0.000 | 0.000 |
1.000 1.000 | 1.000 |
||||||||
| Plot | Lyso | Other | |||||||||||
| Expt D |
1 peptide |
1 spectrum |
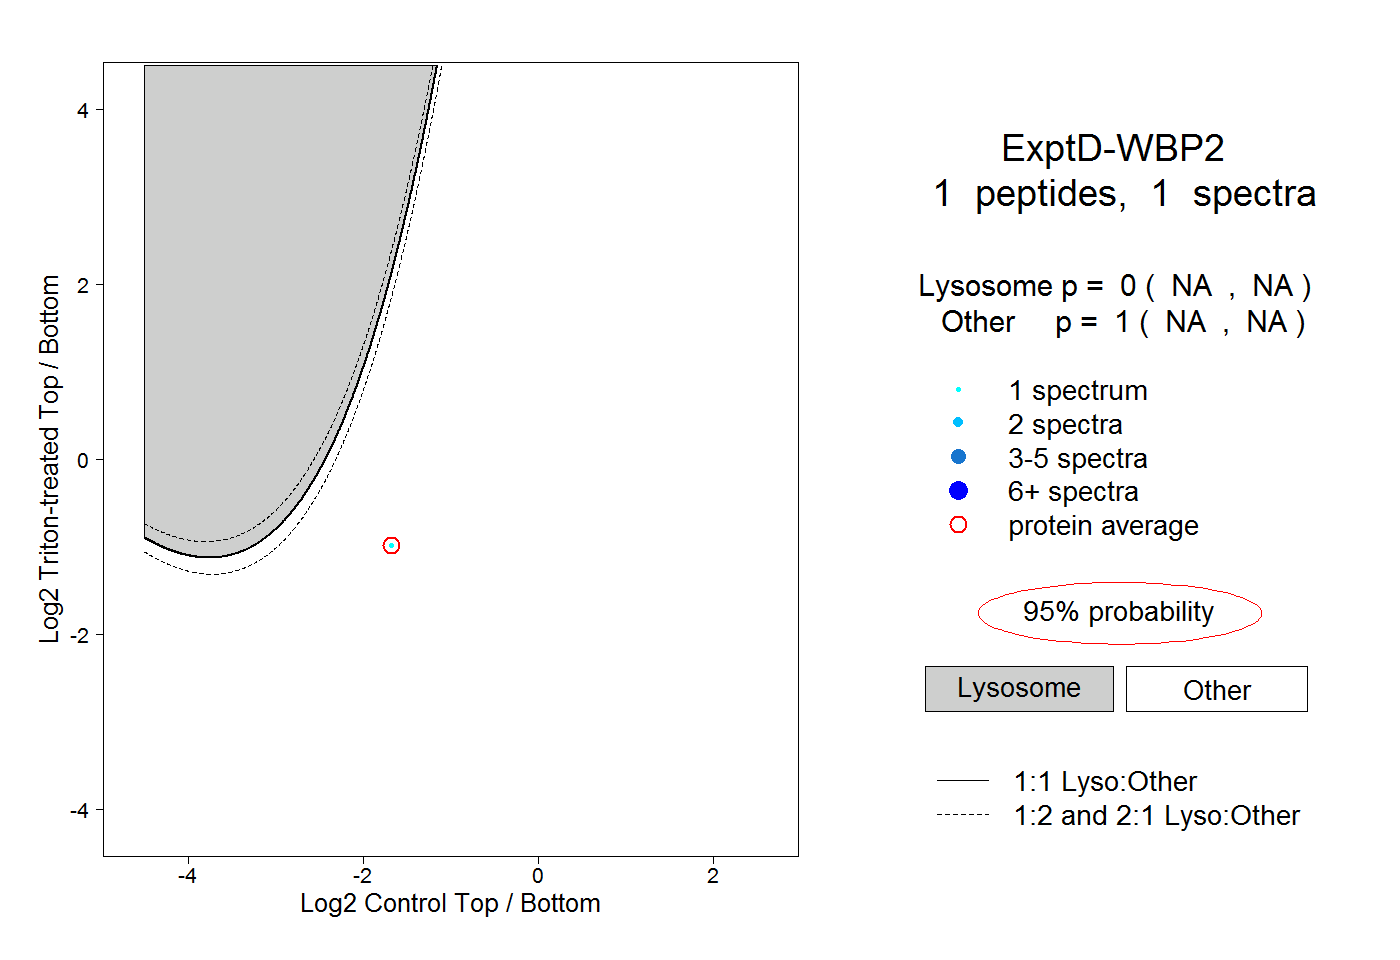 |
0.000 NA | NA |
1.000 NA | NA |