 9
9peptides
spectra
0.047 | 0.123
0.000 | 0.000
0.048 | 0.155
0.415 | 0.534
0.218 | 0.331
0.000 | 0.064
0.000 | 0.000
0.000 | 0.039
10peptides
spectra
0.000 | 0.112
0.850 | 1.000
| Plot | Mito | Lyso | Perox | ER | Golgi | PM | Cytosol | Nucleus | |||||
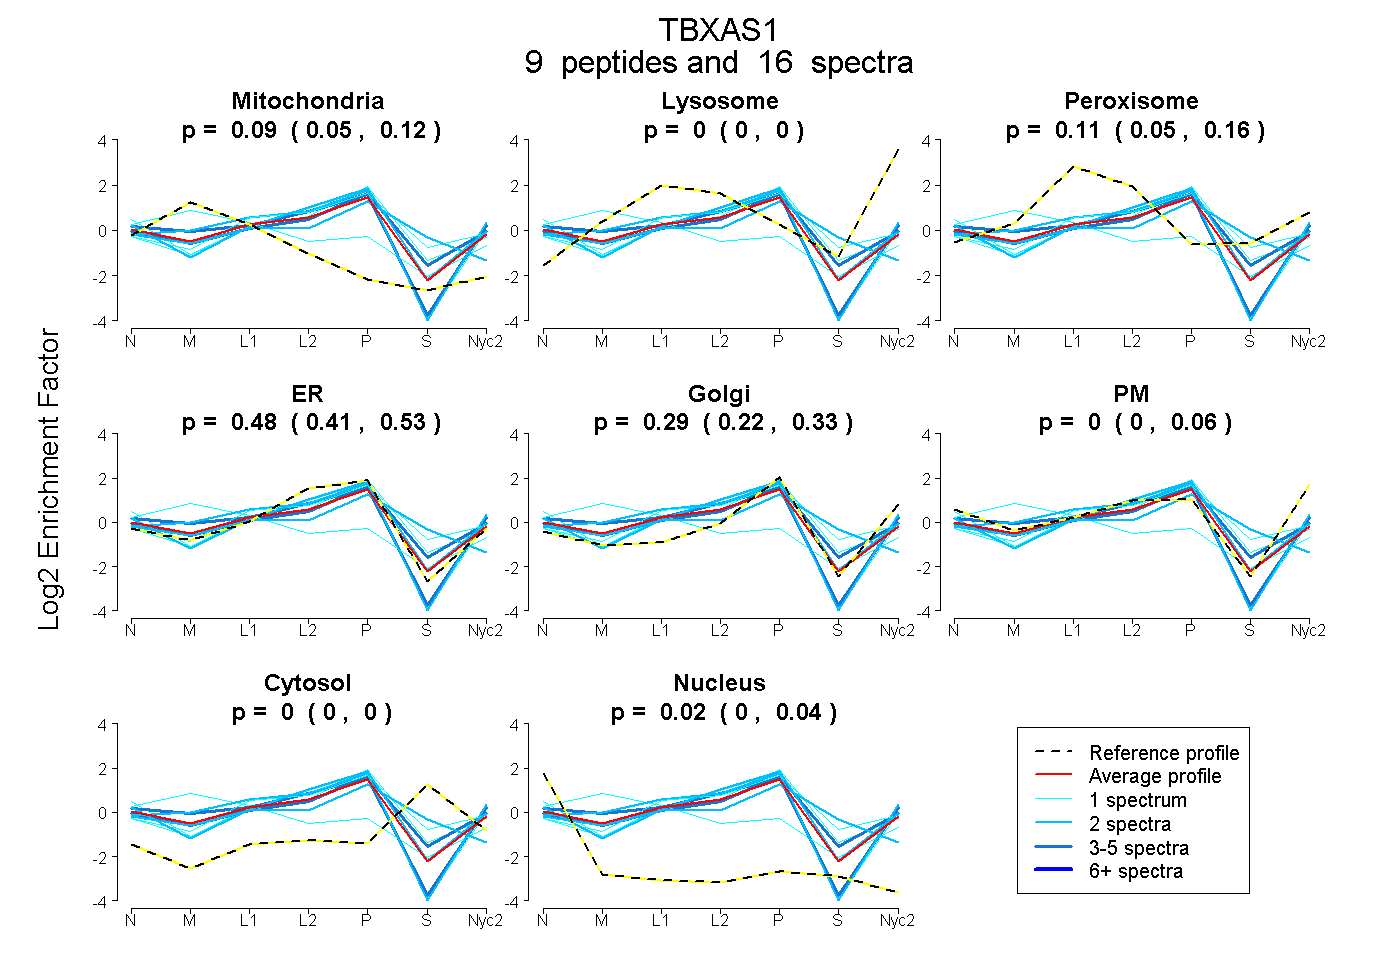
| Expt A |
9 peptides |
16 spectra |
|
0.089 0.047 | 0.123 |
0.000 0.000 | 0.000 |
0.113 0.048 | 0.155 |
0.481 0.415 | 0.534 |
0.295 0.218 | 0.331 |
0.002 0.000 | 0.064 |
0.000 0.000 | 0.000 |
0.021 0.000 | 0.039 |
||
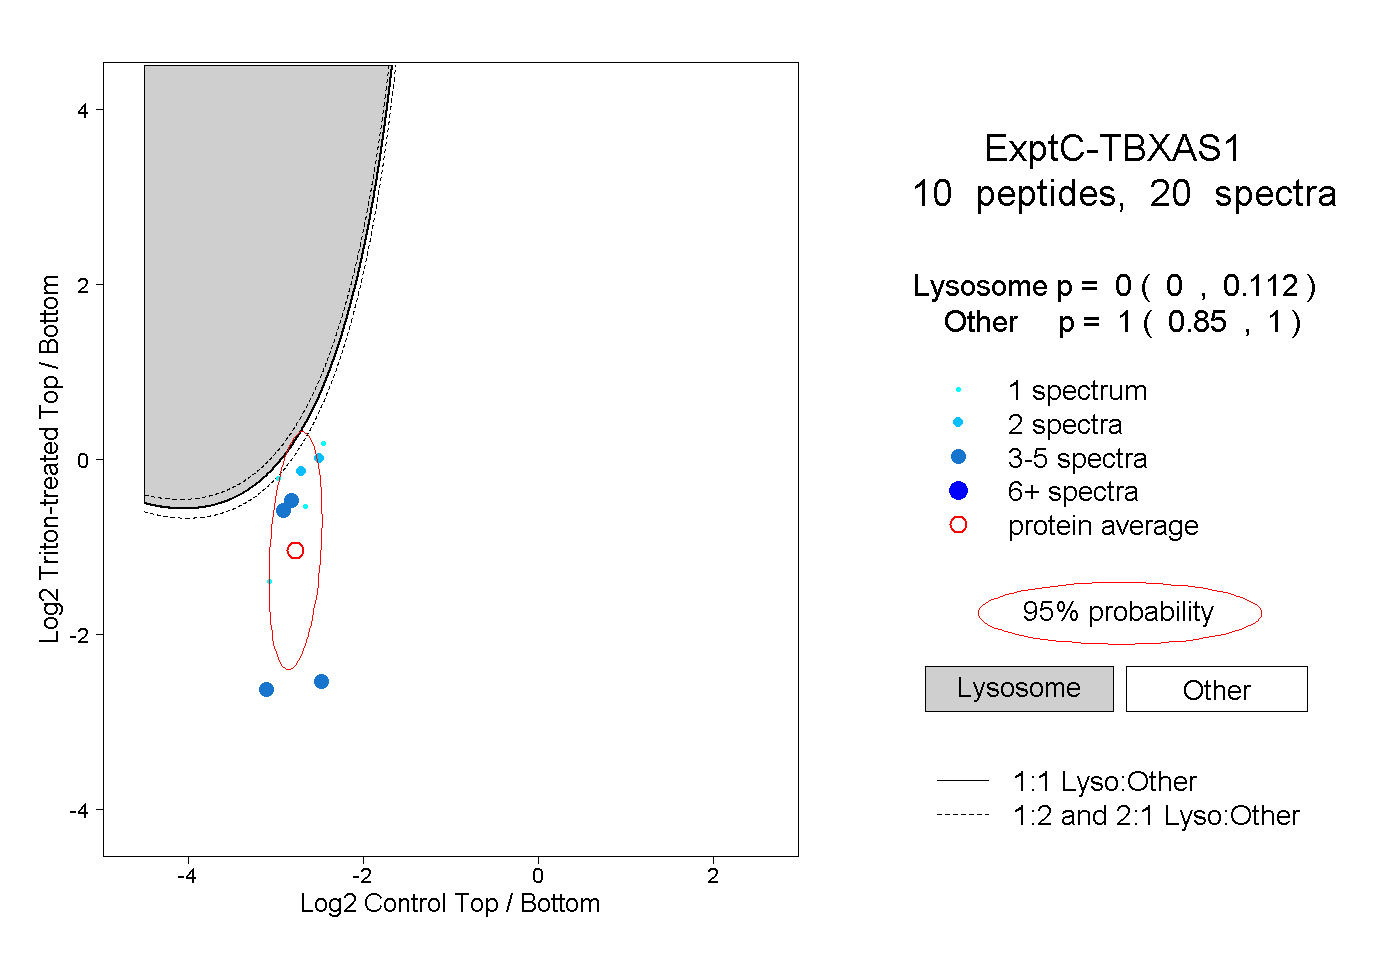
| Plot | Lyso | Other | |||||||||||
| Expt C |
10 peptides |
20 spectra |
|
0.000 0.000 | 0.112 |
1.000 0.850 | 1.000 |