 9
9peptides
spectra
0.047 | 0.123
0.000 | 0.000
0.048 | 0.155
0.415 | 0.534
0.218 | 0.331
0.000 | 0.064
0.000 | 0.000
0.000 | 0.039
| Plot | Mito | Lyso | Perox | ER | Golgi | PM | Cytosol | Nucleus | |||||
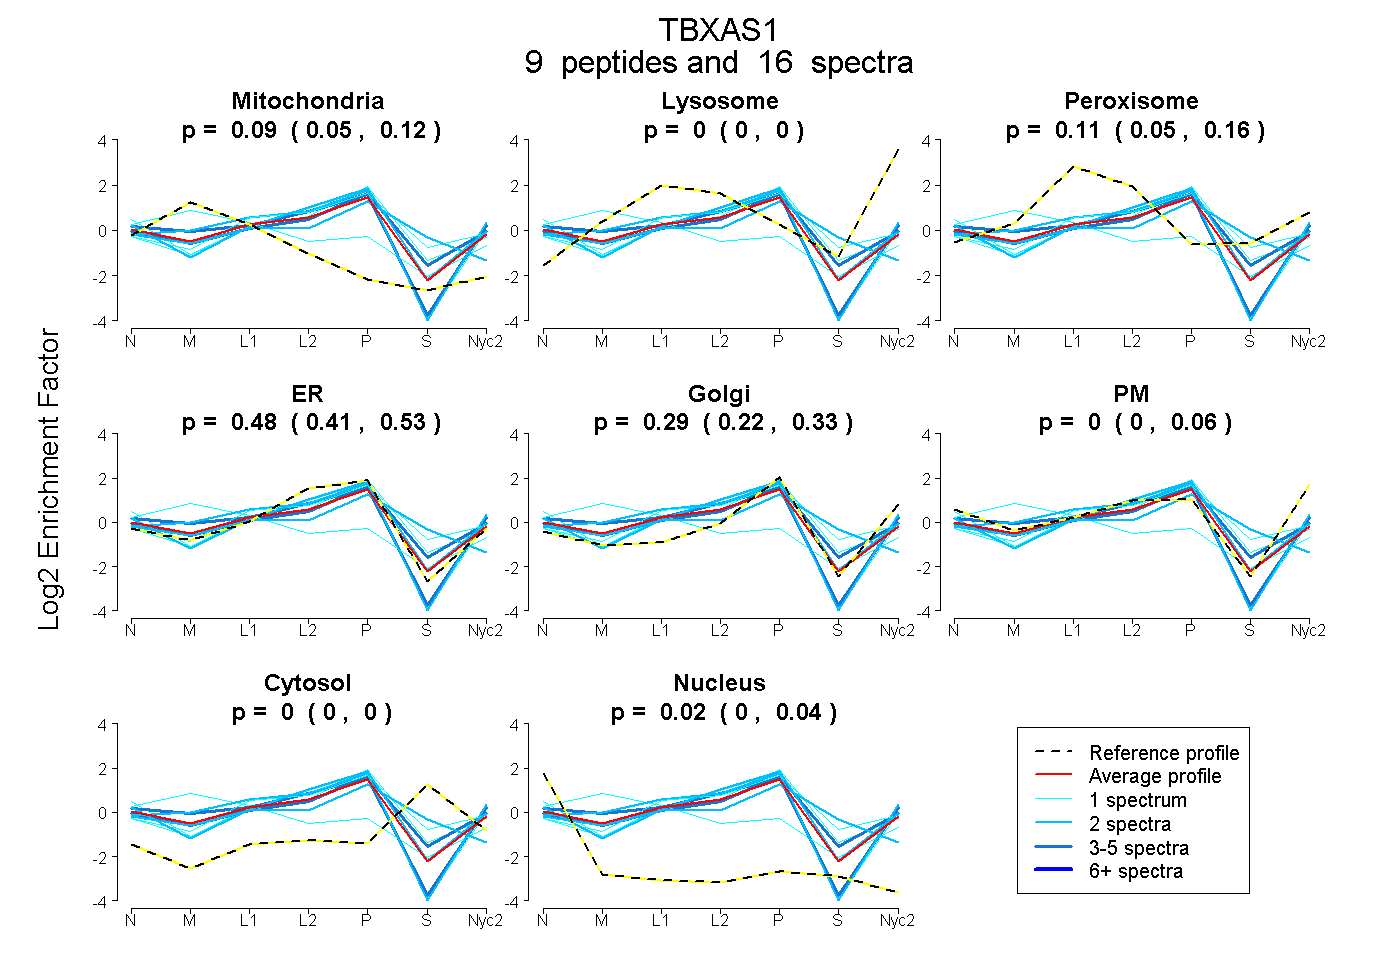
| Expt A |
9 peptides |
16 spectra |
|
0.089 0.047 | 0.123 |
0.000 0.000 | 0.000 |
0.113 0.048 | 0.155 |
0.481 0.415 | 0.534 |
0.295 0.218 | 0.331 |
0.002 0.000 | 0.064 |
0.000 0.000 | 0.000 |
0.021 0.000 | 0.039 |
| 1 spectrum, HPEPSPFVGNLMFFR | 0.000 | 0.000 | 0.071 | 0.587 | 0.193 | 0.000 | 0.150 | 0.000 | ||
| 1 spectrum, NVLALR | 0.000 | 0.000 | 0.226 | 0.447 | 0.166 | 0.000 | 0.161 | 0.000 | ||
| 3 spectra, LIADSVLMLR | 0.101 | 0.000 | 0.000 | 0.571 | 0.000 | 0.328 | 0.000 | 0.000 | ||
| 1 spectrum, EVDLFMEK | 0.000 | 0.000 | 0.000 | 0.728 | 0.000 | 0.214 | 0.000 | 0.058 | ||
| 2 spectra, YGPLCGYYLGR | 0.073 | 0.000 | 0.065 | 0.531 | 0.000 | 0.000 | 0.330 | 0.000 | ||
| 2 spectra, QGFWESHLELR | 0.000 | 0.000 | 0.000 | 0.725 | 0.063 | 0.143 | 0.056 | 0.013 | ||
| 1 spectrum, MASGLEPK | 0.546 | 0.000 | 0.072 | 0.000 | 0.179 | 0.203 | 0.000 | 0.000 | ||
| 2 spectra, MYPPAFR | 0.074 | 0.000 | 0.000 | 0.613 | 0.000 | 0.313 | 0.000 | 0.000 | ||
| 3 spectra, LTLLQVLHK | 0.025 | 0.000 | 0.139 | 0.377 | 0.377 | 0.000 | 0.082 | 0.000 |
| Plot | Lyso | Other | |||||||||||
| Expt C |
10 peptides |
20 spectra |
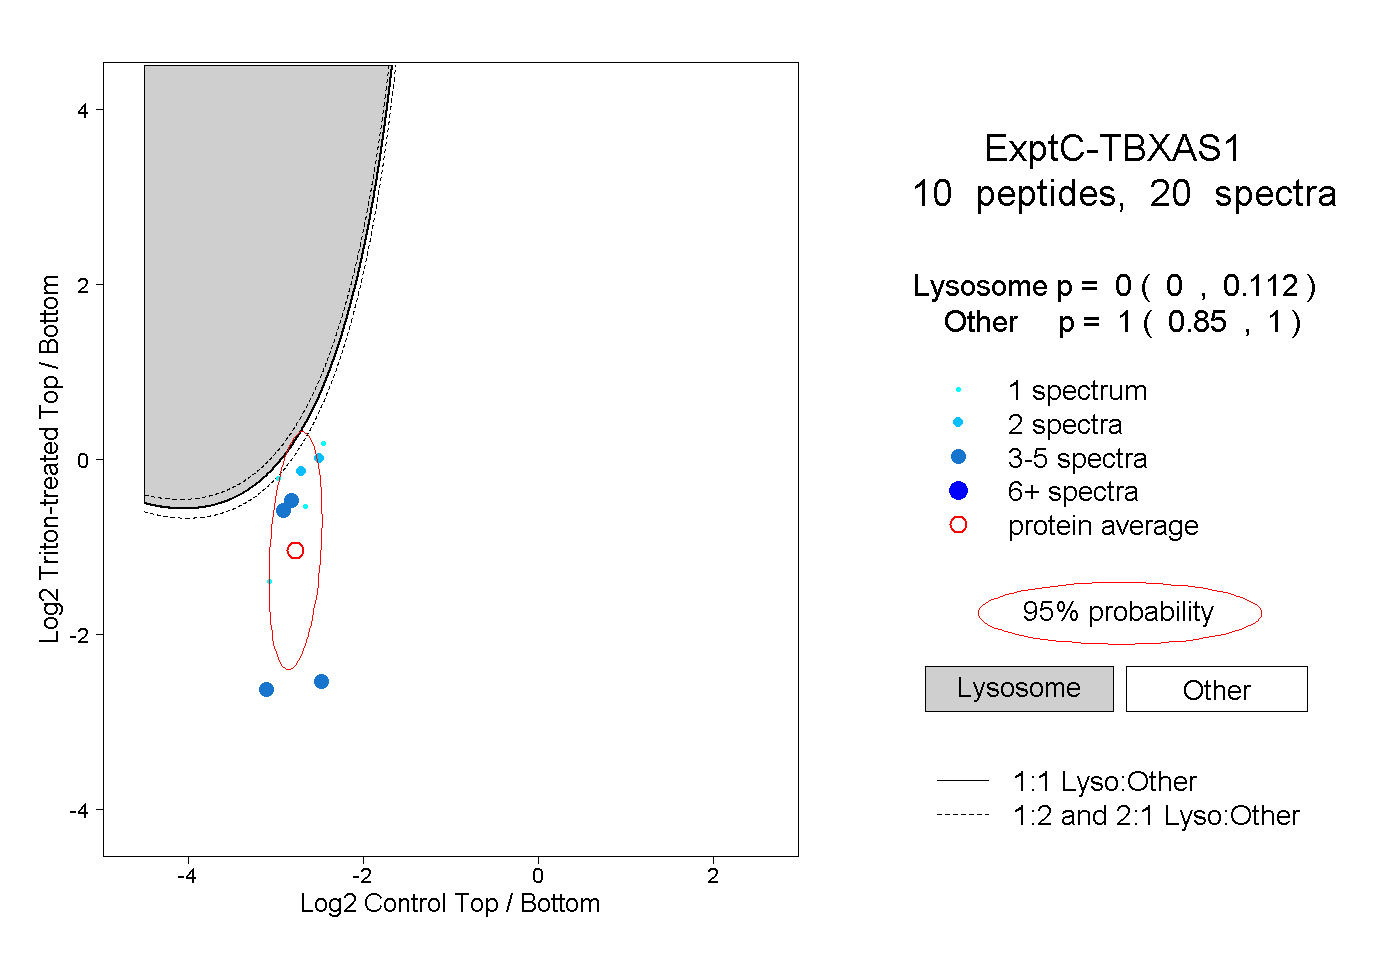 |
0.000 0.000 | 0.112 |
1.000 0.850 | 1.000 |