 11
11peptides
spectra
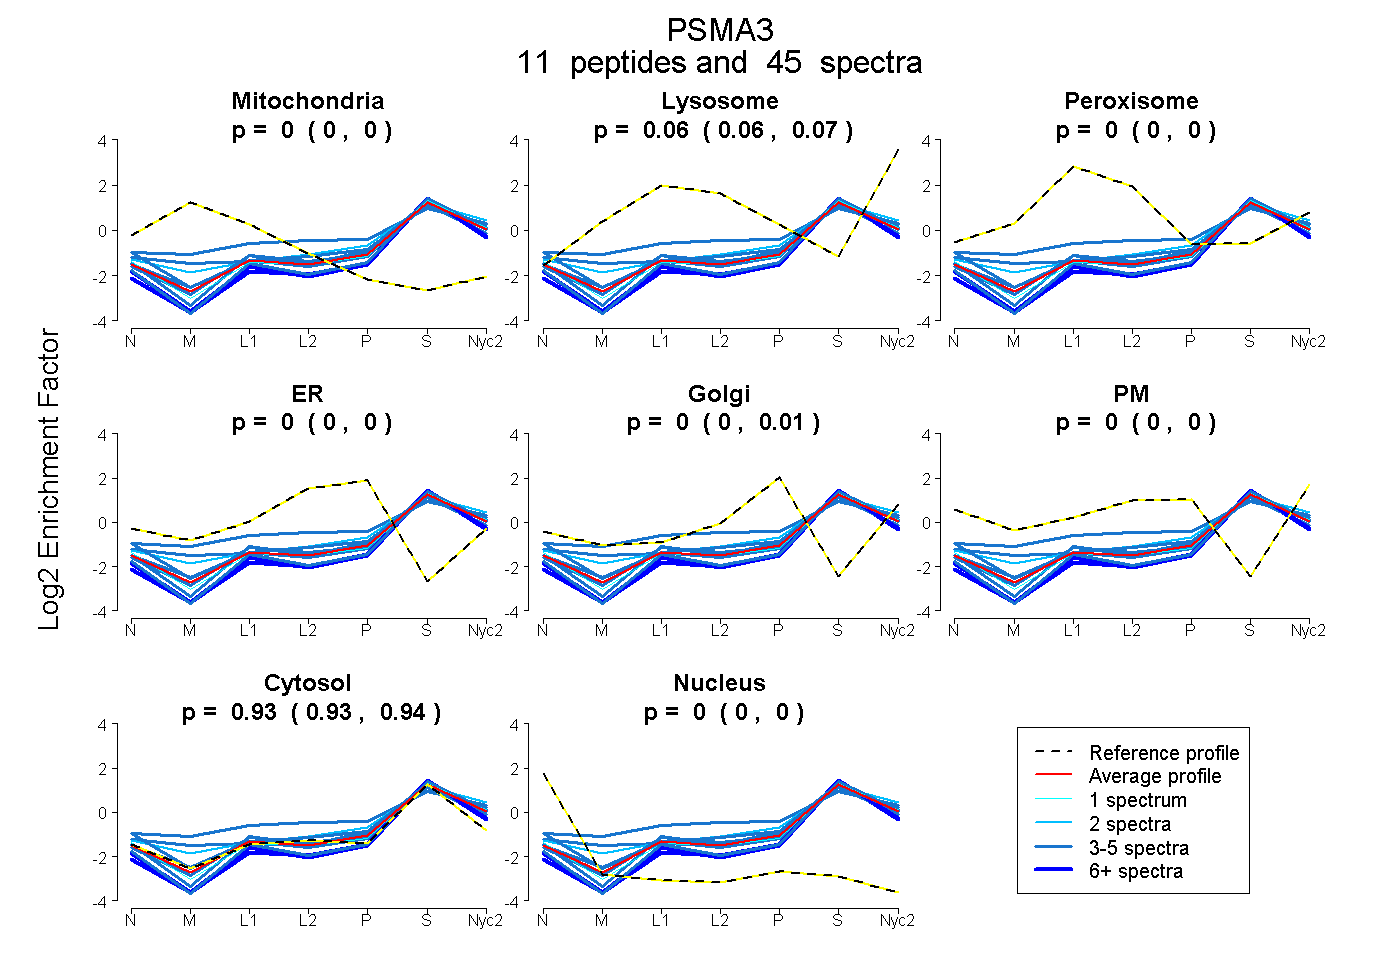
0.000 | 0.000
0.057 | 0.069
0.000 | 0.000
0.000 | 0.000
0.000 | 0.008
0.000 | 0.000
0.928 | 0.938
0.000 | 0.000
7peptides
spectra
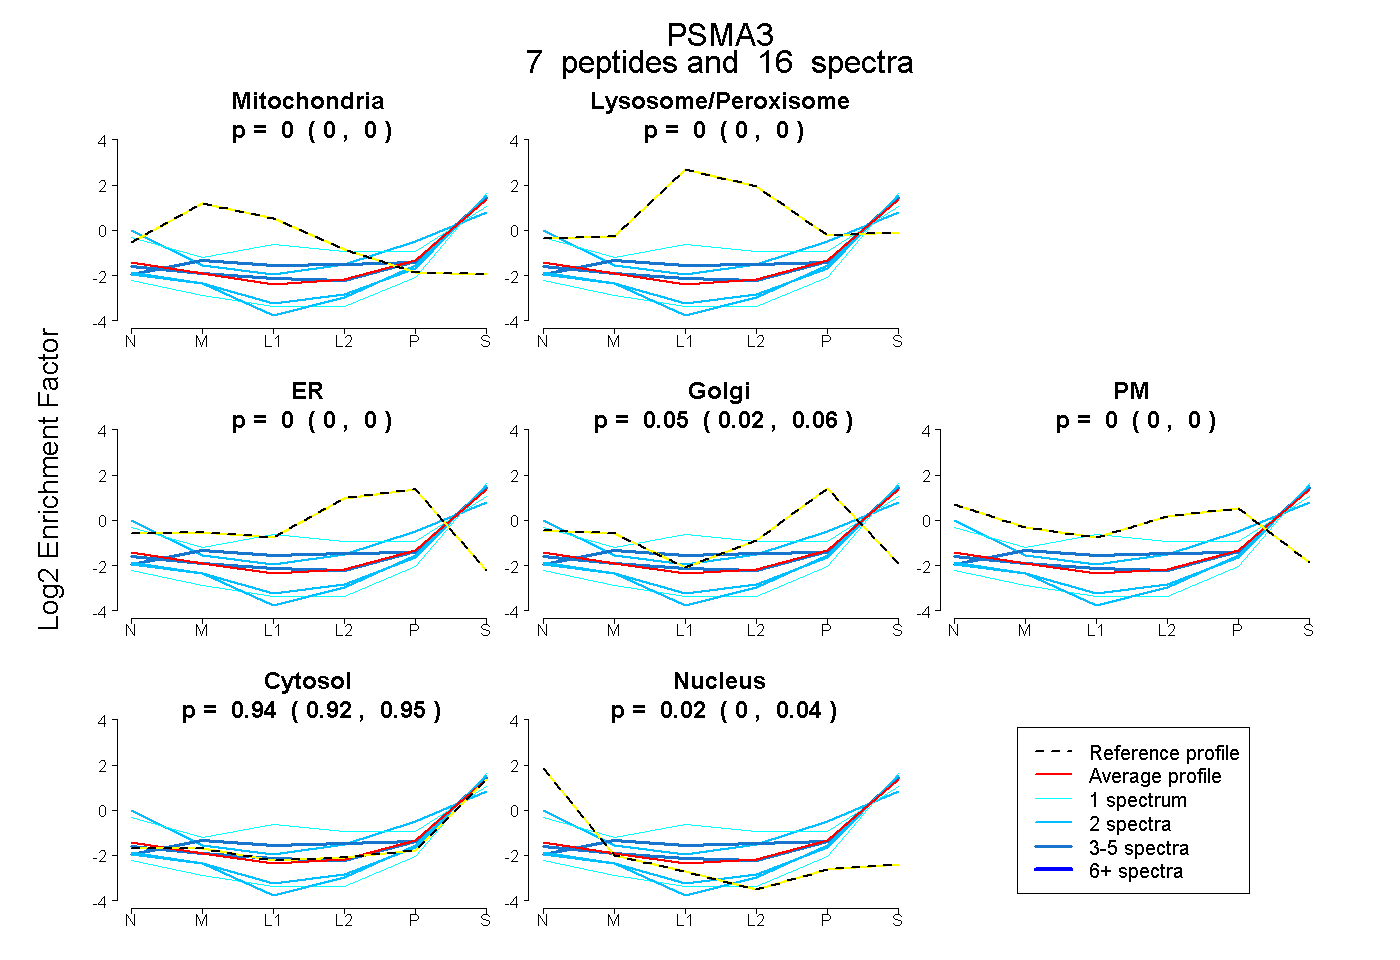
0.000 | 0.000
0.000 | 0.000
0.000 | 0.000
0.024 | 0.063
0.000 | 0.000
0.918 | 0.955
0.000 | 0.036
11peptides
spectra
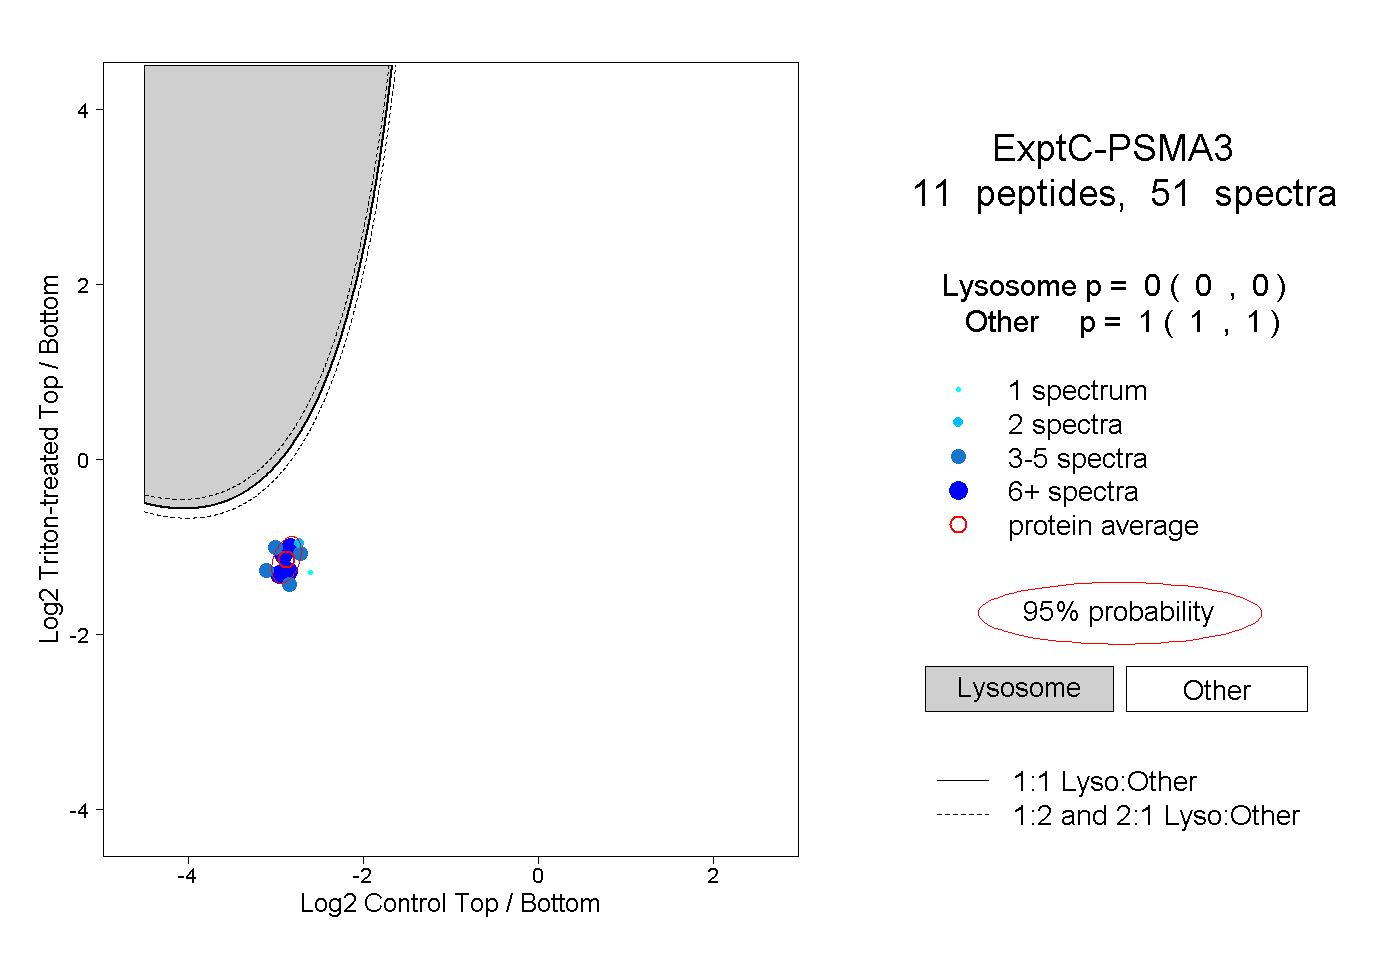
0.000 | 0.000
1.000 | 1.000
1peptide
spectrum
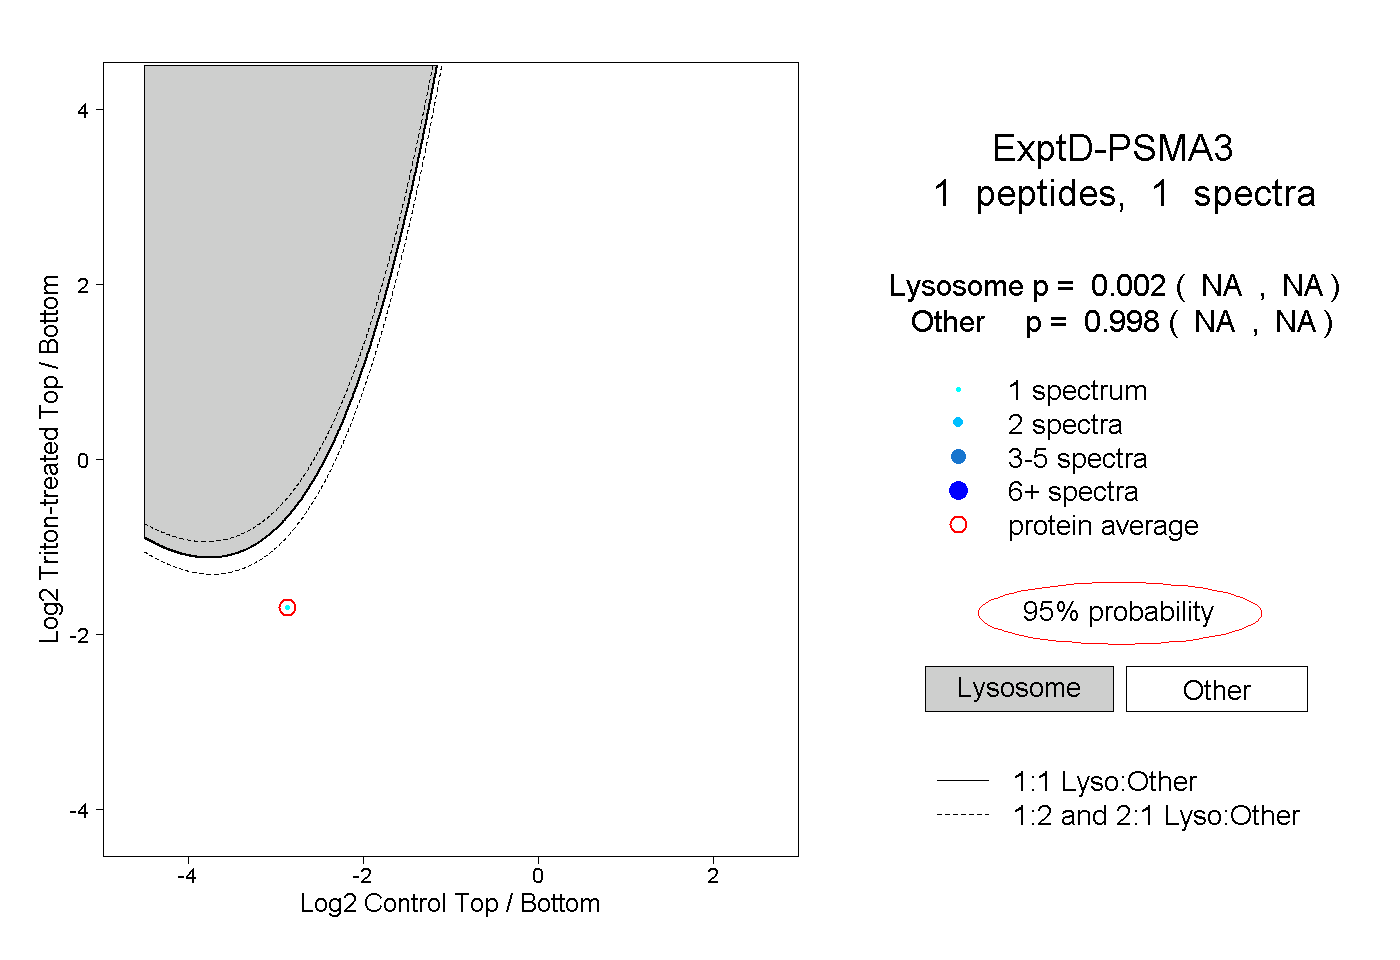
NA | NA
NA | NA