 11
11peptides
spectra
0.000 | 0.000
0.057 | 0.069
0.000 | 0.000
0.000 | 0.000
0.000 | 0.008
0.000 | 0.000
0.928 | 0.938
0.000 | 0.000
| Plot | Mito | Lyso | Perox | ER | Golgi | PM | Cytosol | Nucleus | |||||
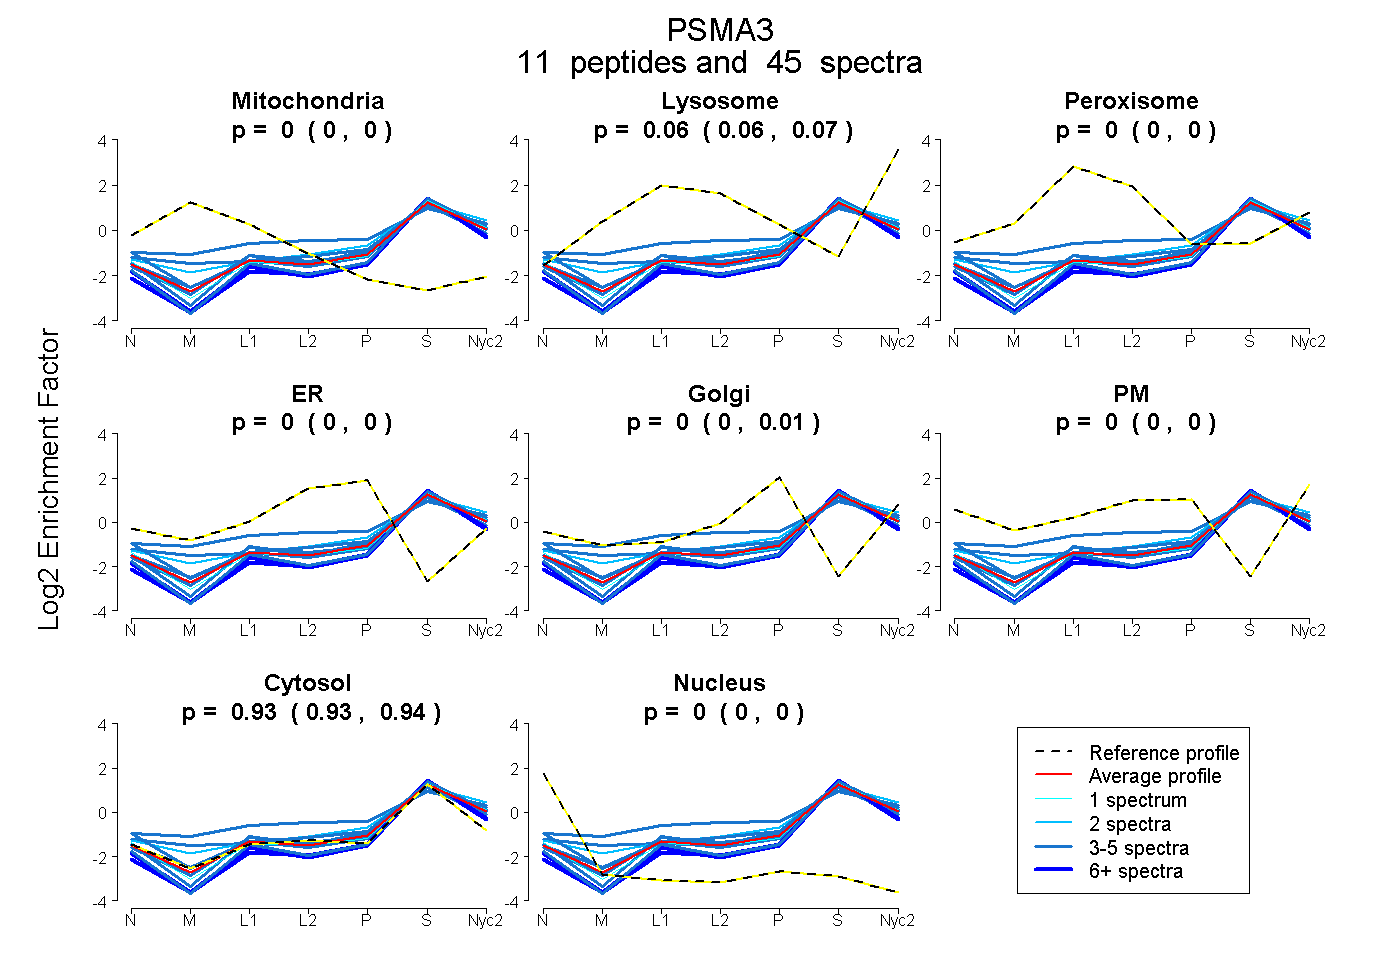
| Expt A |
11 peptides |
45 spectra |
|
0.000 0.000 | 0.000 |
0.064 0.057 | 0.069 |
0.000 0.000 | 0.000 |
0.000 0.000 | 0.000 |
0.002 0.000 | 0.008 |
0.000 0.000 | 0.000 |
0.934 0.928 | 0.938 |
0.000 0.000 | 0.000 |
| 3 spectra, SNFGYNIPLK | 0.000 | 0.000 | 0.000 | 0.000 | 0.000 | 0.000 | 1.000 | 0.000 | ||
| 4 spectra, DGVVFGVEK | 0.000 | 0.077 | 0.000 | 0.000 | 0.000 | 0.000 | 0.923 | 0.000 | ||
| 5 spectra, VFQVEYAMK | 0.000 | 0.055 | 0.000 | 0.000 | 0.027 | 0.062 | 0.856 | 0.000 | ||
| 5 spectra, SLADIAR | 0.000 | 0.044 | 0.000 | 0.000 | 0.010 | 0.000 | 0.946 | 0.000 | ||
| 2 spectra, LFNVDR | 0.000 | 0.139 | 0.000 | 0.000 | 0.059 | 0.000 | 0.802 | 0.000 | ||
| 4 spectra, EEASNFR | 0.031 | 0.084 | 0.000 | 0.000 | 0.043 | 0.000 | 0.842 | 0.000 | ||
| 7 spectra, IIYIVHDEVK | 0.000 | 0.000 | 0.000 | 0.000 | 0.000 | 0.000 | 1.000 | 0.000 | ||
| 7 spectra, AVENSSTAIGIR | 0.000 | 0.000 | 0.000 | 0.000 | 0.000 | 0.000 | 1.000 | 0.000 | ||
| 4 spectra, LYEEGSNK | 0.000 | 0.081 | 0.000 | 0.000 | 0.000 | 0.000 | 0.919 | 0.000 | ||
| 1 spectrum, SSIGTGYDLSASTFSPDGR | 0.000 | 0.044 | 0.000 | 0.000 | 0.000 | 0.000 | 0.956 | 0.000 | ||
| 3 spectra, HVGMAVAGLLADAR | 0.000 | 0.189 | 0.065 | 0.000 | 0.038 | 0.051 | 0.658 | 0.000 |
| Plot | Mito | Lyso or Perox | ER | Golgi | PM | Cytosol | Nucleus | ||||||
| Expt B |
7 peptides |
16 spectra |
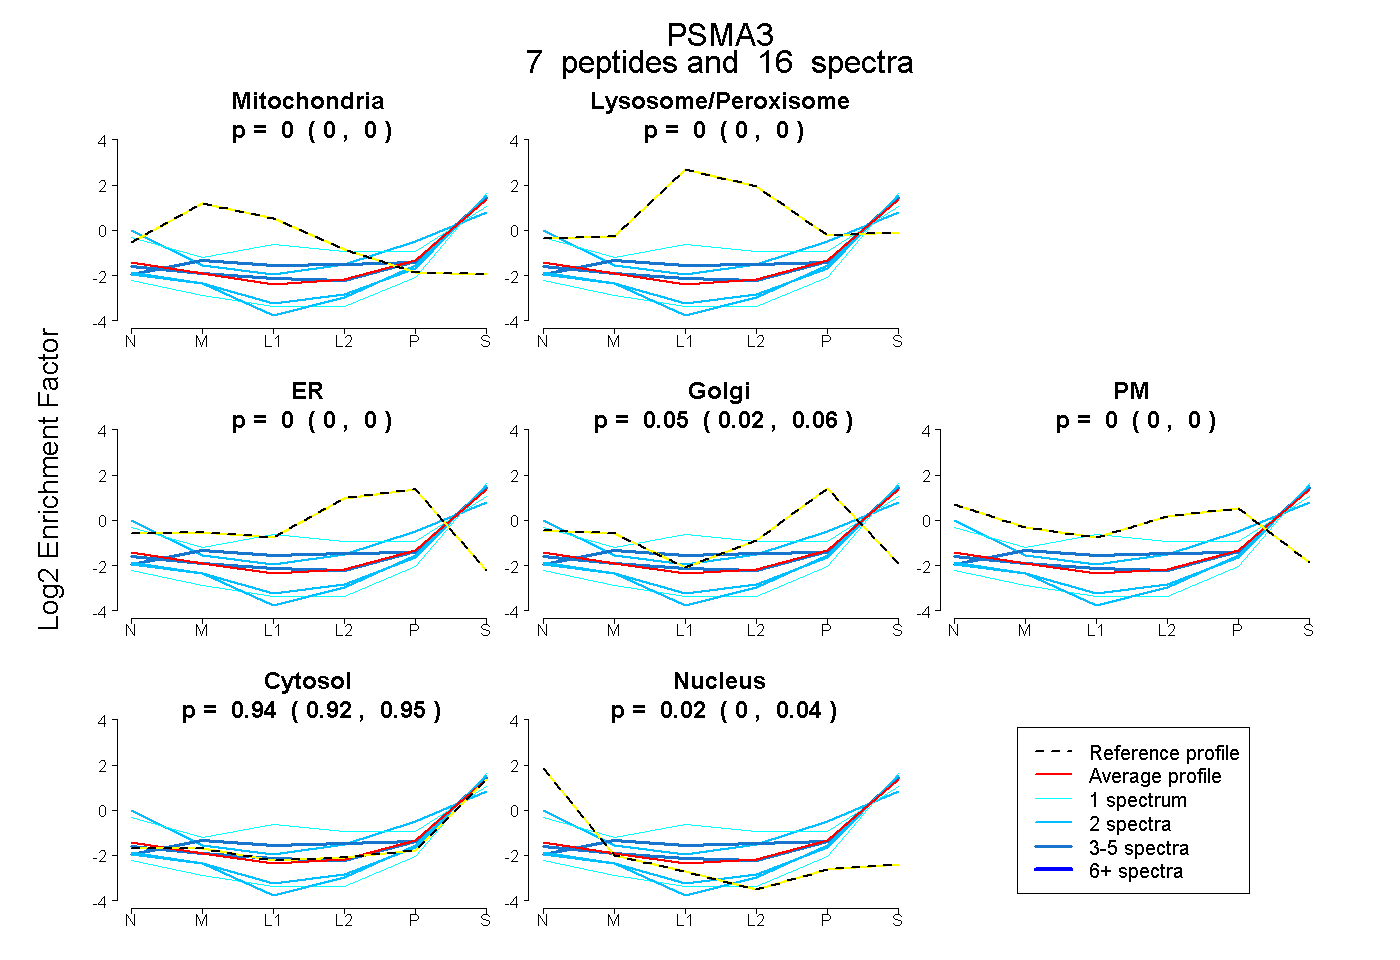 |
0.000 0.000 | 0.000 |
0.000 0.000 | 0.000 |
0.000 0.000 | 0.000 |
0.046 0.024 | 0.063 |
0.000 0.000 | 0.000 |
0.938 0.918 | 0.955 |
0.016 0.000 | 0.036 |
|||
| Plot | Lyso | Other | |||||||||||
| Expt C |
11 peptides |
51 spectra |
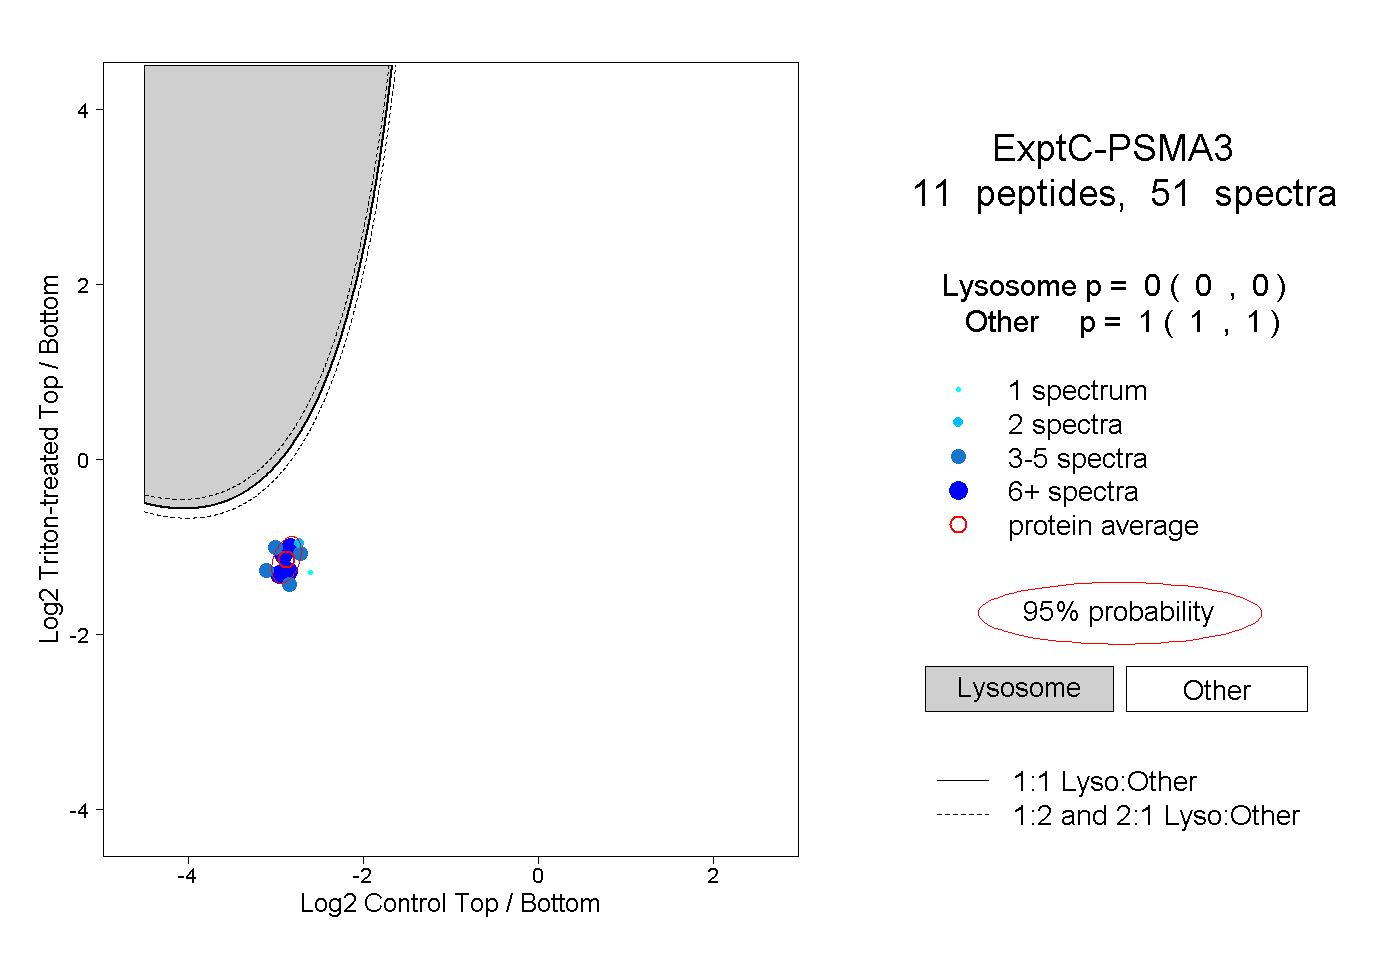 |
0.000 0.000 | 0.000 |
1.000 1.000 | 1.000 |
||||||||
| Plot | Lyso | Other | |||||||||||
| Expt D |
1 peptide |
1 spectrum |
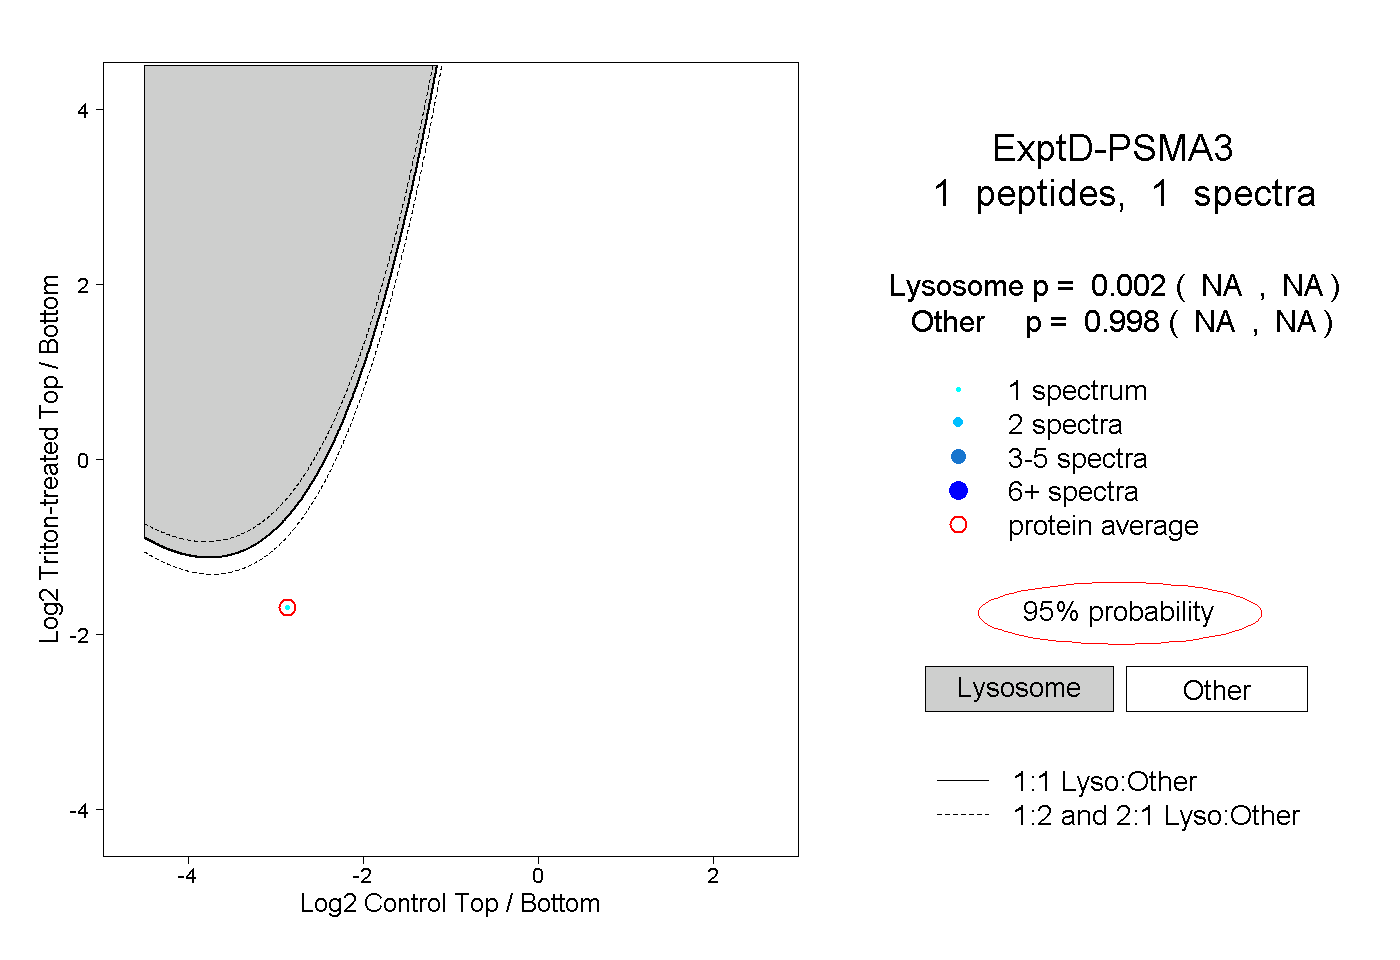 |
0.002 NA | NA |
0.998 NA | NA |