 9
9peptides
spectra
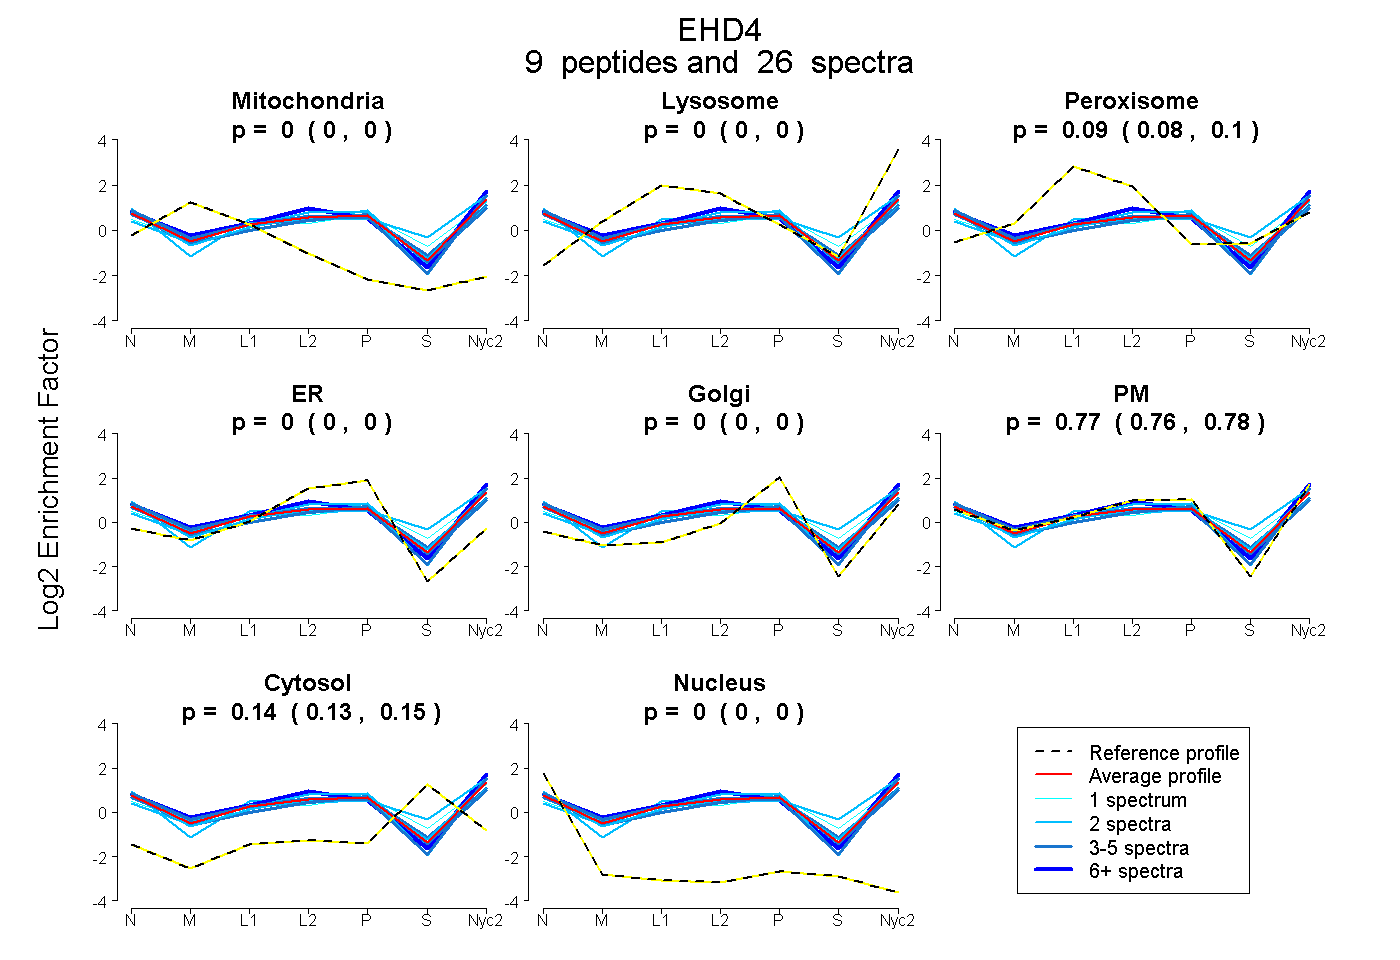
0.000 | 0.000
0.000 | 0.000
0.082 | 0.095
0.000 | 0.000
0.000 | 0.000
0.758 | 0.778
0.135 | 0.147
0.000 | 0.000
2peptides
spectra
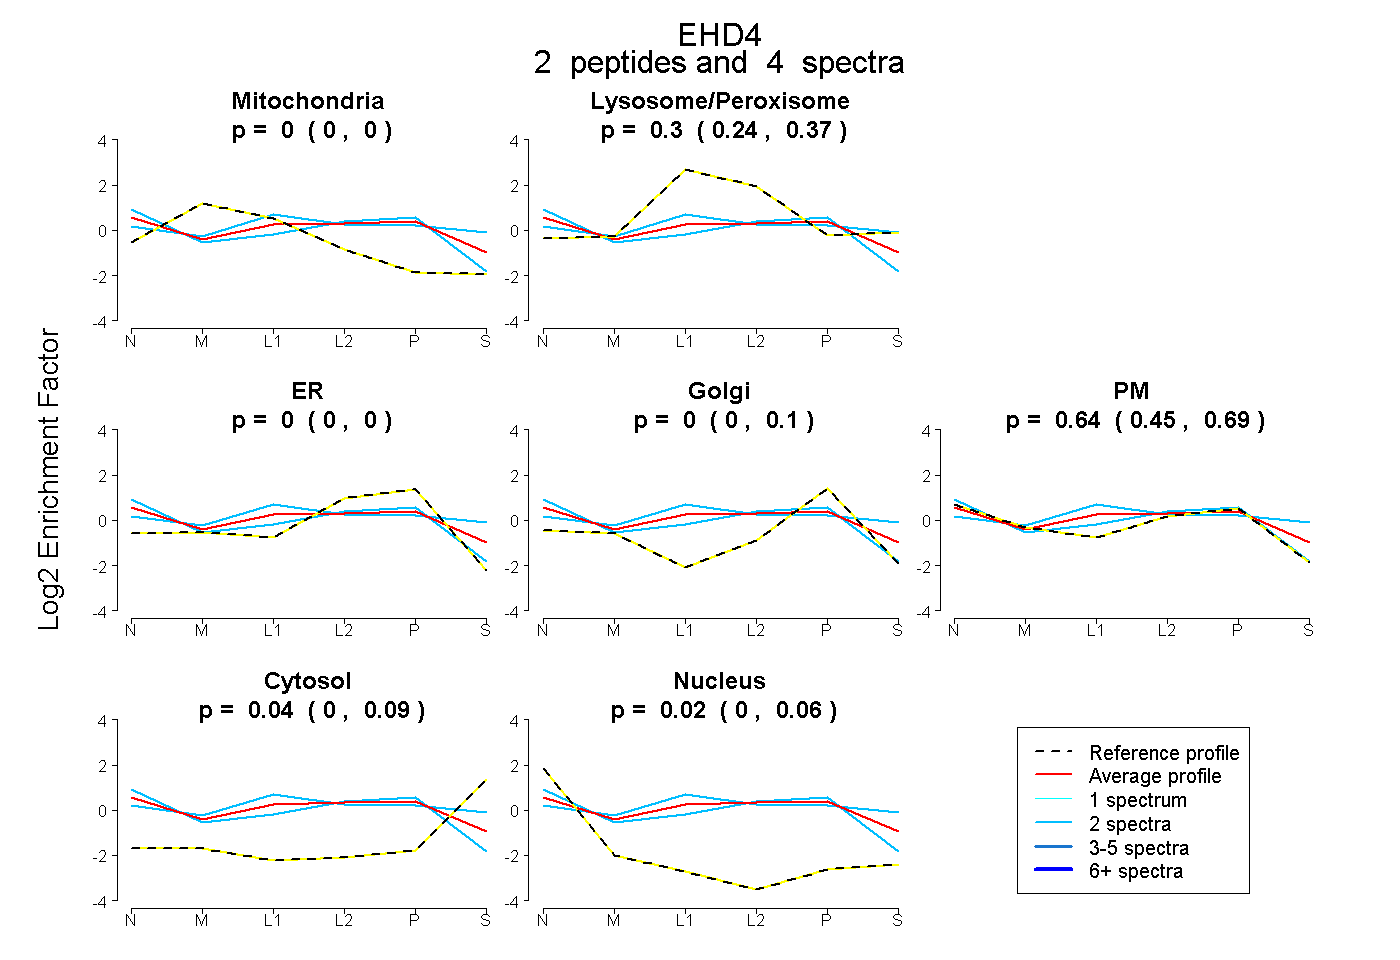
0.000 | 0.000
0.241 | 0.371
0.000 | 0.000
0.000 | 0.099
0.449 | 0.693
0.000 | 0.095
0.000 | 0.056
12peptides
spectra
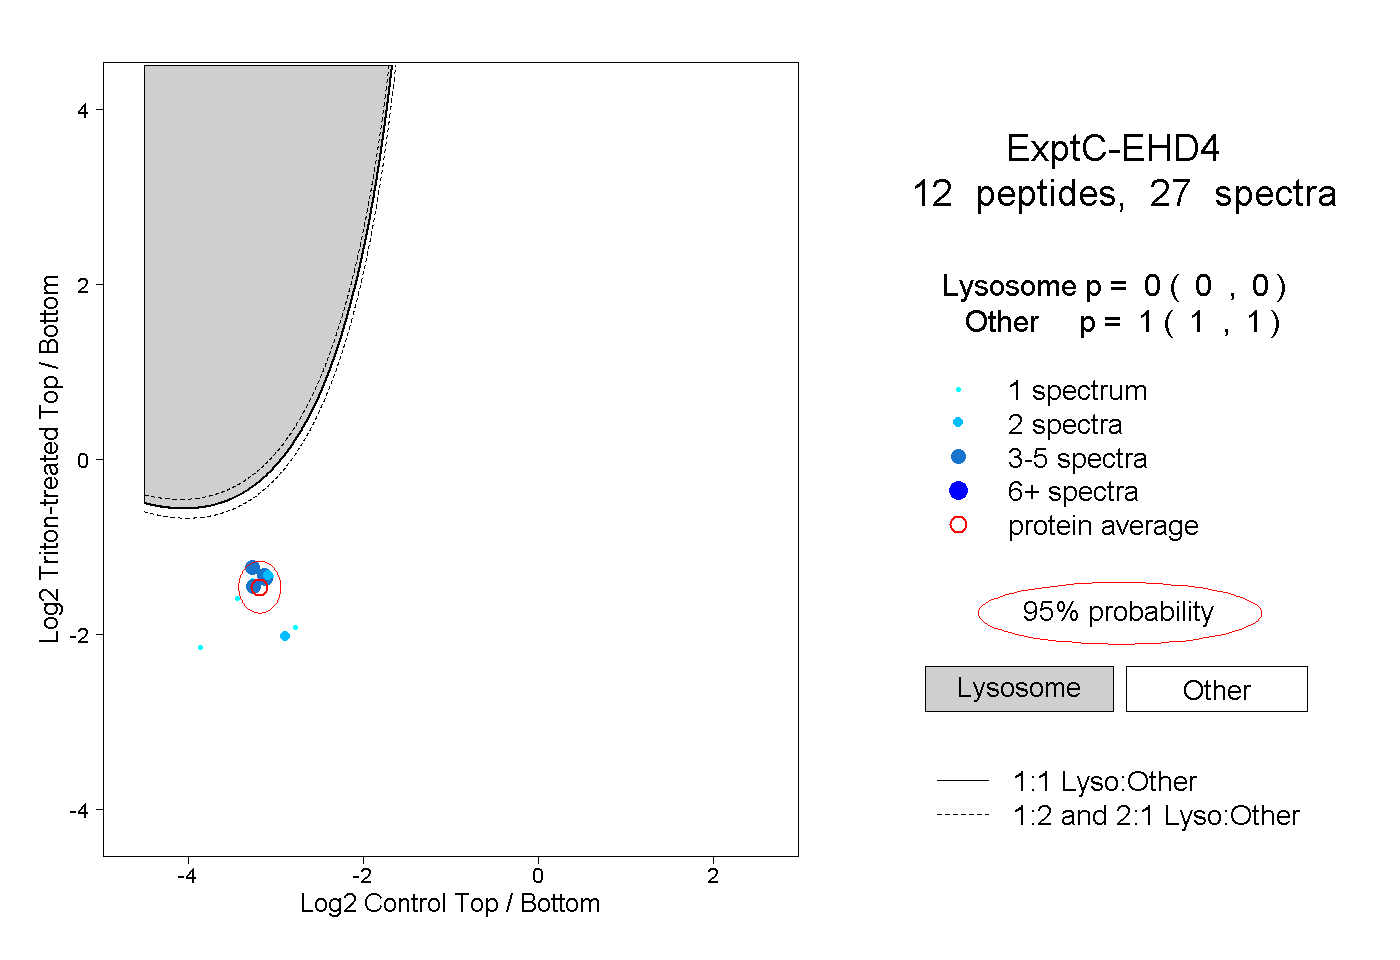
0.000 | 0.000
1.000 | 1.000
1peptide
spectra
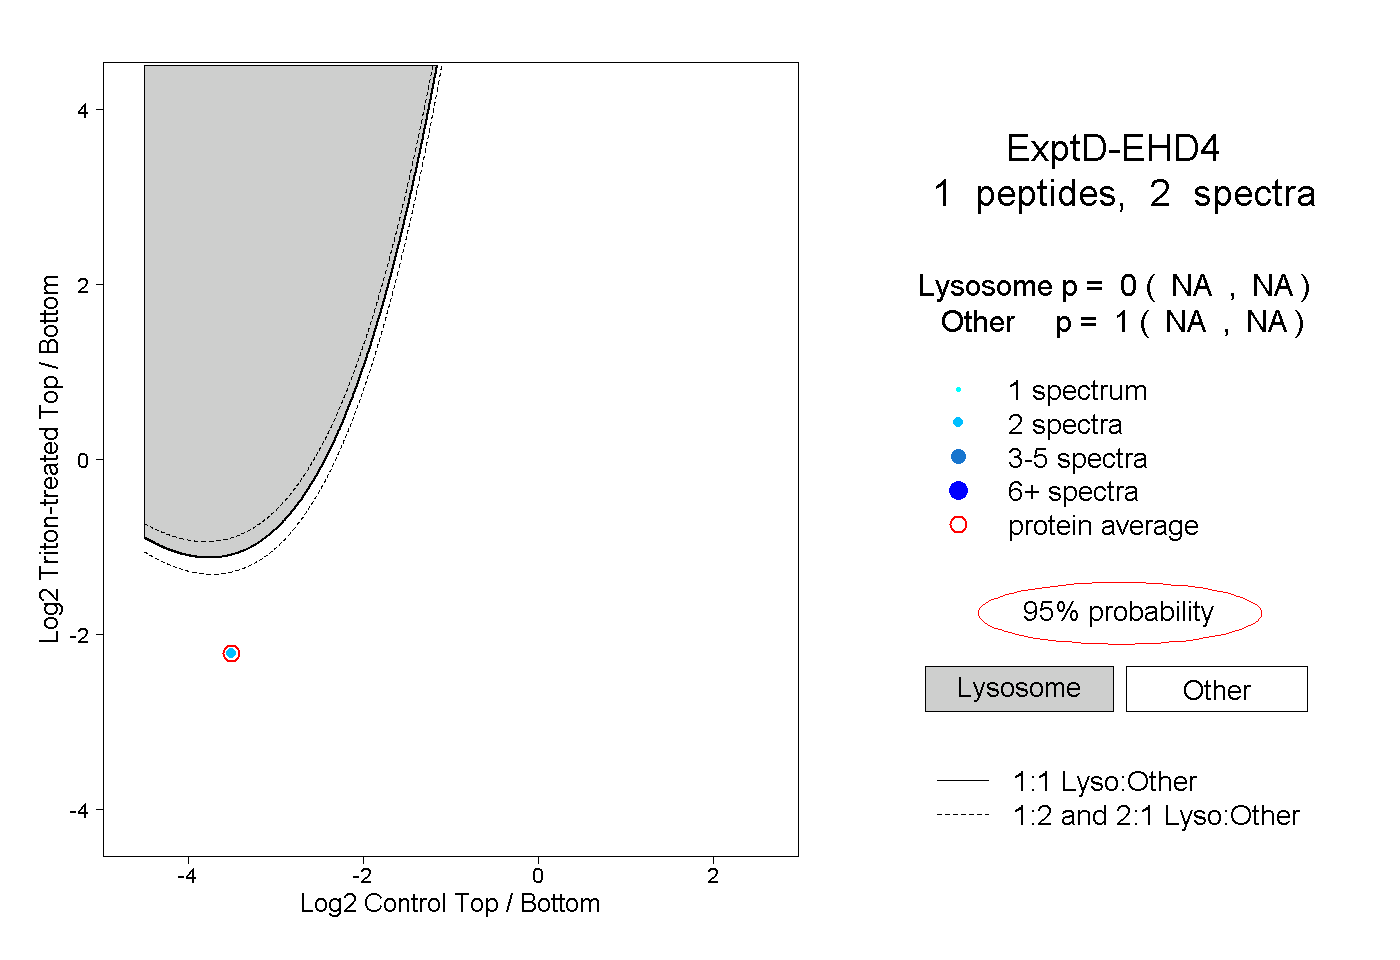
NA | NA
NA | NA