 9
9peptides
spectra
0.000 | 0.000
0.000 | 0.000
0.082 | 0.095
0.000 | 0.000
0.000 | 0.000
0.758 | 0.778
0.135 | 0.147
0.000 | 0.000
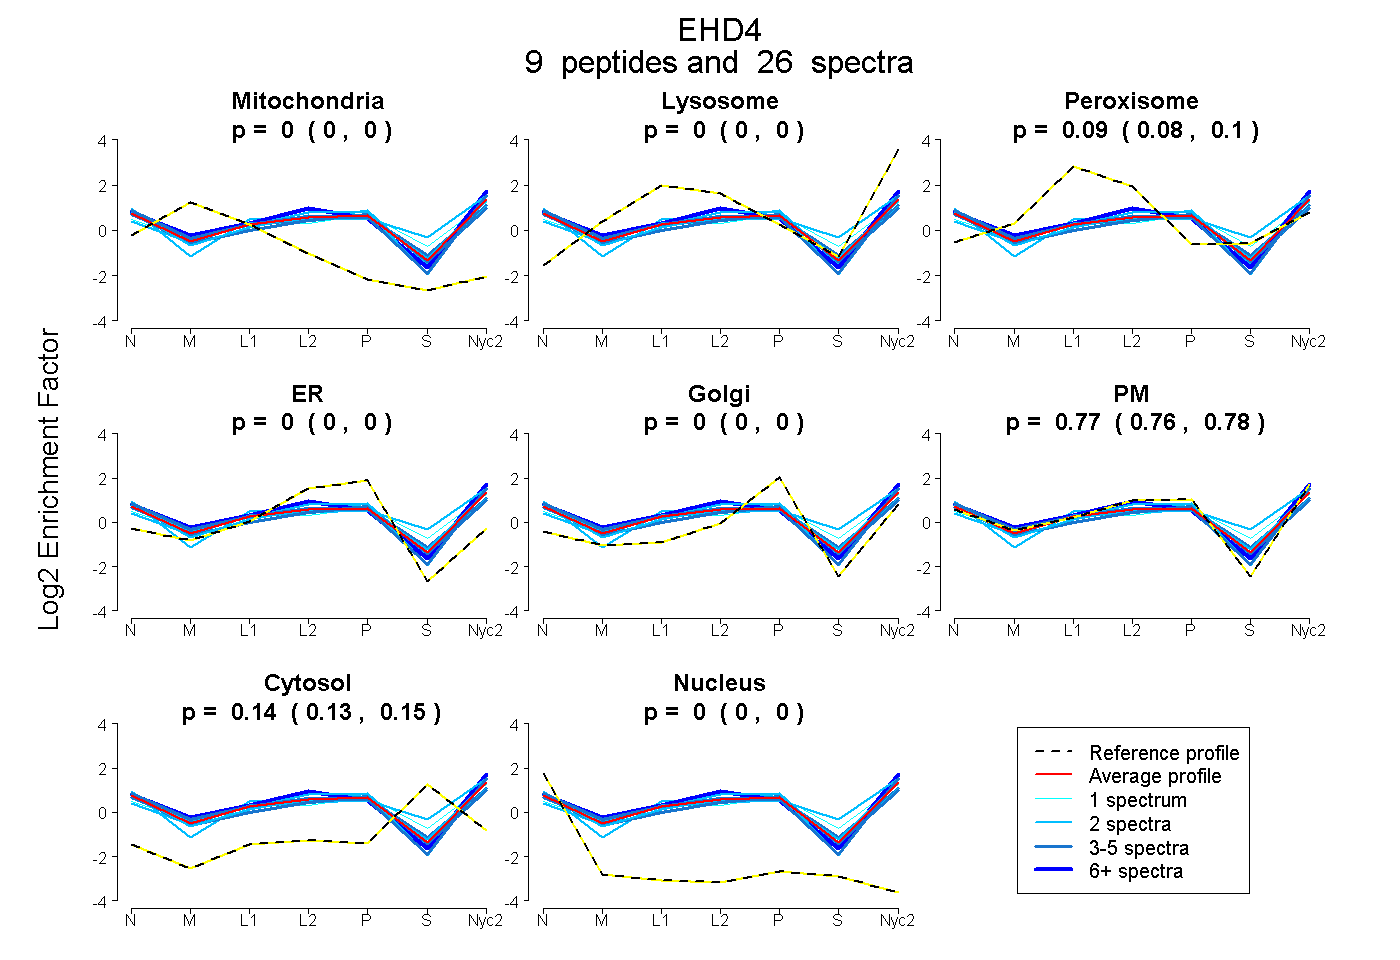
| Plot | Mito | Lyso | Perox | ER | Golgi | PM | Cytosol | Nucleus | |||||
| Expt A |
9 peptides |
26 spectra |
|
0.000 0.000 | 0.000 |
0.000 0.000 | 0.000 |
0.089 0.082 | 0.095 |
0.000 0.000 | 0.000 |
0.000 0.000 | 0.000 |
0.769 0.758 | 0.778 |
0.142 0.135 | 0.147 |
0.000 0.000 | 0.000 |
| 6 spectra, FGNAFLNR | 0.000 | 0.009 | 0.117 | 0.000 | 0.000 | 0.815 | 0.059 | 0.000 | ||
| 1 spectrum, AMQEQLENYDFTK | 0.000 | 0.013 | 0.140 | 0.000 | 0.000 | 0.639 | 0.207 | 0.000 | ||
| 4 spectra, SGGMDAVQTVTGGLR | 0.000 | 0.000 | 0.087 | 0.000 | 0.000 | 0.839 | 0.035 | 0.039 | ||
| 4 spectra, ADQVDTQQLMR | 0.000 | 0.000 | 0.123 | 0.000 | 0.000 | 0.700 | 0.170 | 0.006 | ||
| 2 spectra, LFEAEAQDLFR | 0.000 | 0.000 | 0.065 | 0.000 | 0.000 | 0.770 | 0.165 | 0.000 | ||
| 2 spectra, EGADEEEWVVAK | 0.000 | 0.000 | 0.077 | 0.000 | 0.000 | 0.766 | 0.121 | 0.036 | ||
| 2 spectra, FMCSQLPNQVLK | 0.000 | 0.138 | 0.094 | 0.000 | 0.000 | 0.520 | 0.248 | 0.000 | ||
| 3 spectra, LDISDEFSEAIK | 0.000 | 0.000 | 0.046 | 0.000 | 0.000 | 0.765 | 0.158 | 0.031 | ||
| 2 spectra, LIEAVDNMLTNK | 0.000 | 0.000 | 0.054 | 0.000 | 0.000 | 0.889 | 0.043 | 0.014 |
| Plot | Mito | Lyso or Perox | ER | Golgi | PM | Cytosol | Nucleus | ||||||
| Expt B |
2 peptides |
4 spectra |
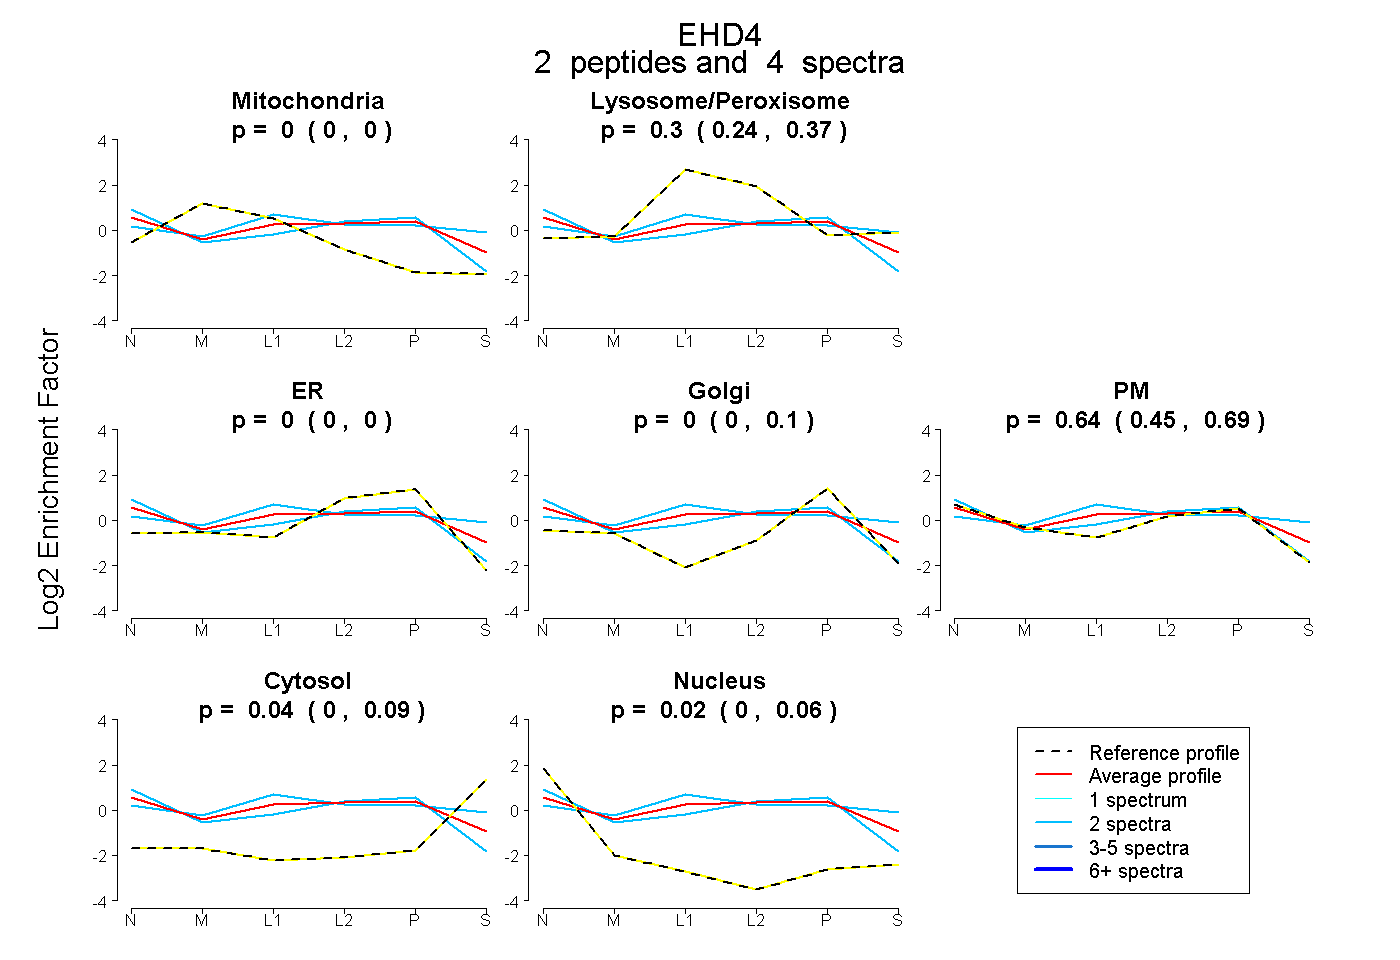 |
0.000 0.000 | 0.000 |
0.297 0.241 | 0.371 |
0.000 0.000 | 0.000 |
0.000 0.000 | 0.099 |
0.642 0.449 | 0.693 |
0.045 0.000 | 0.095 |
0.017 0.000 | 0.056 |
|||
| Plot | Lyso | Other | |||||||||||
| Expt C |
12 peptides |
27 spectra |
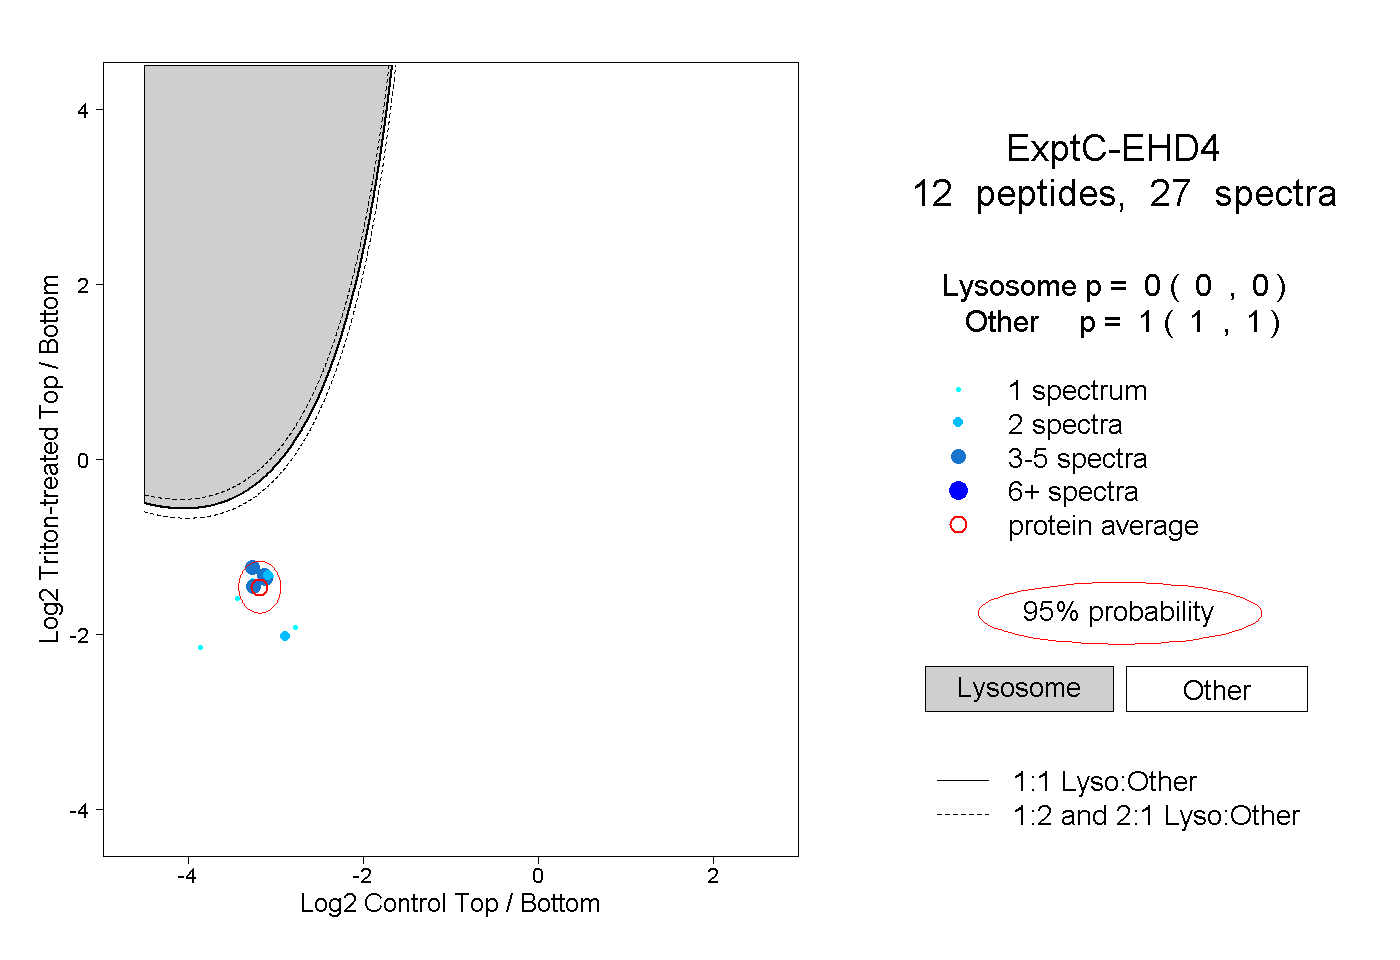 |
0.000 0.000 | 0.000 |
1.000 1.000 | 1.000 |
||||||||
| Plot | Lyso | Other | |||||||||||
| Expt D |
1 peptide |
2 spectra |
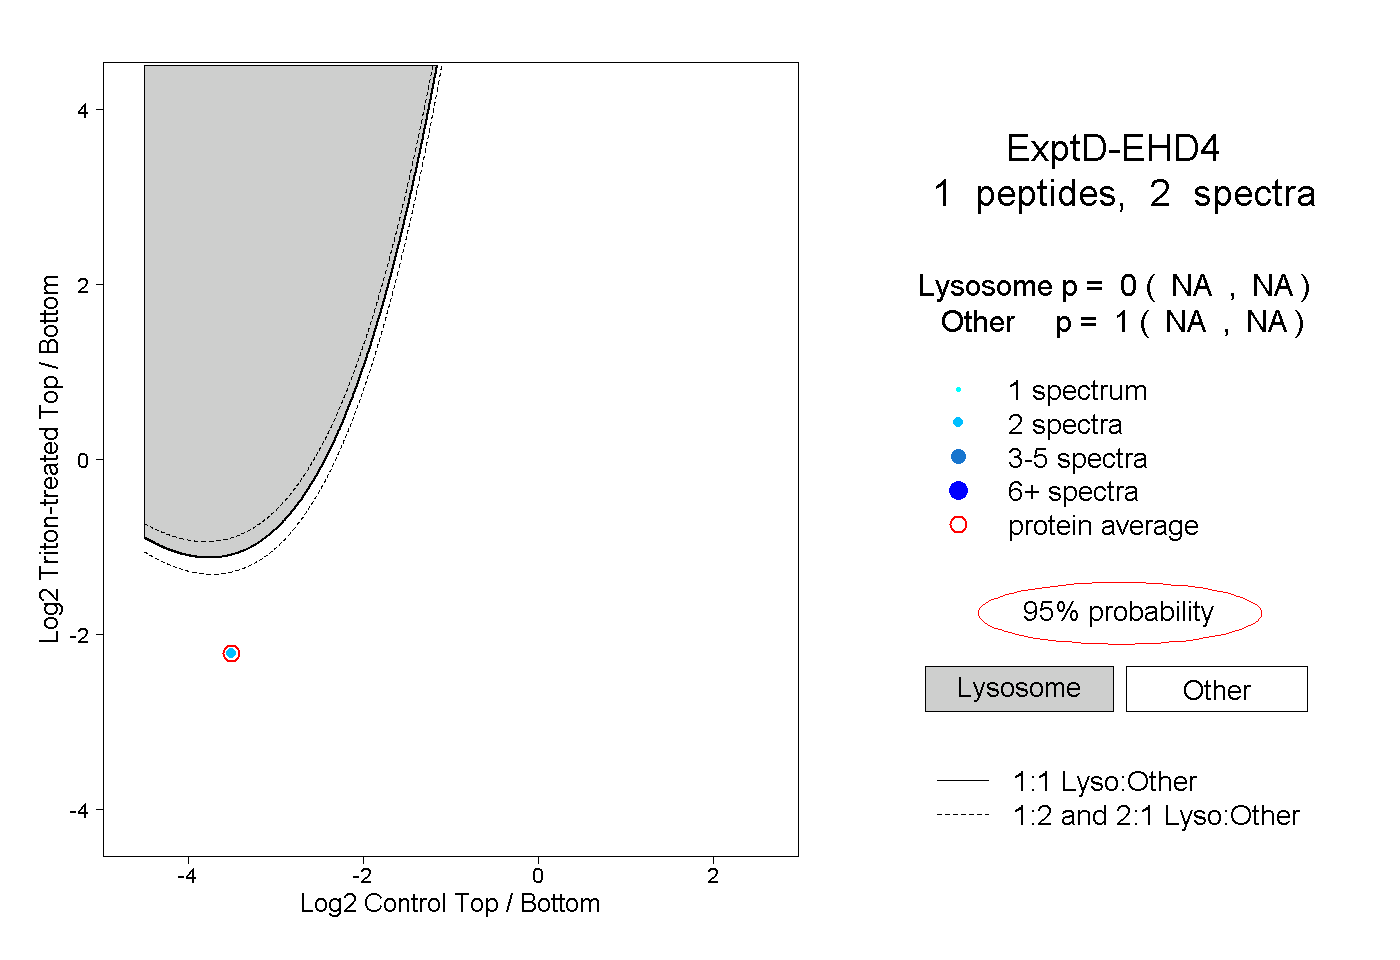 |
0.000 NA | NA |
1.000 NA | NA |