 4
4peptides
spectra
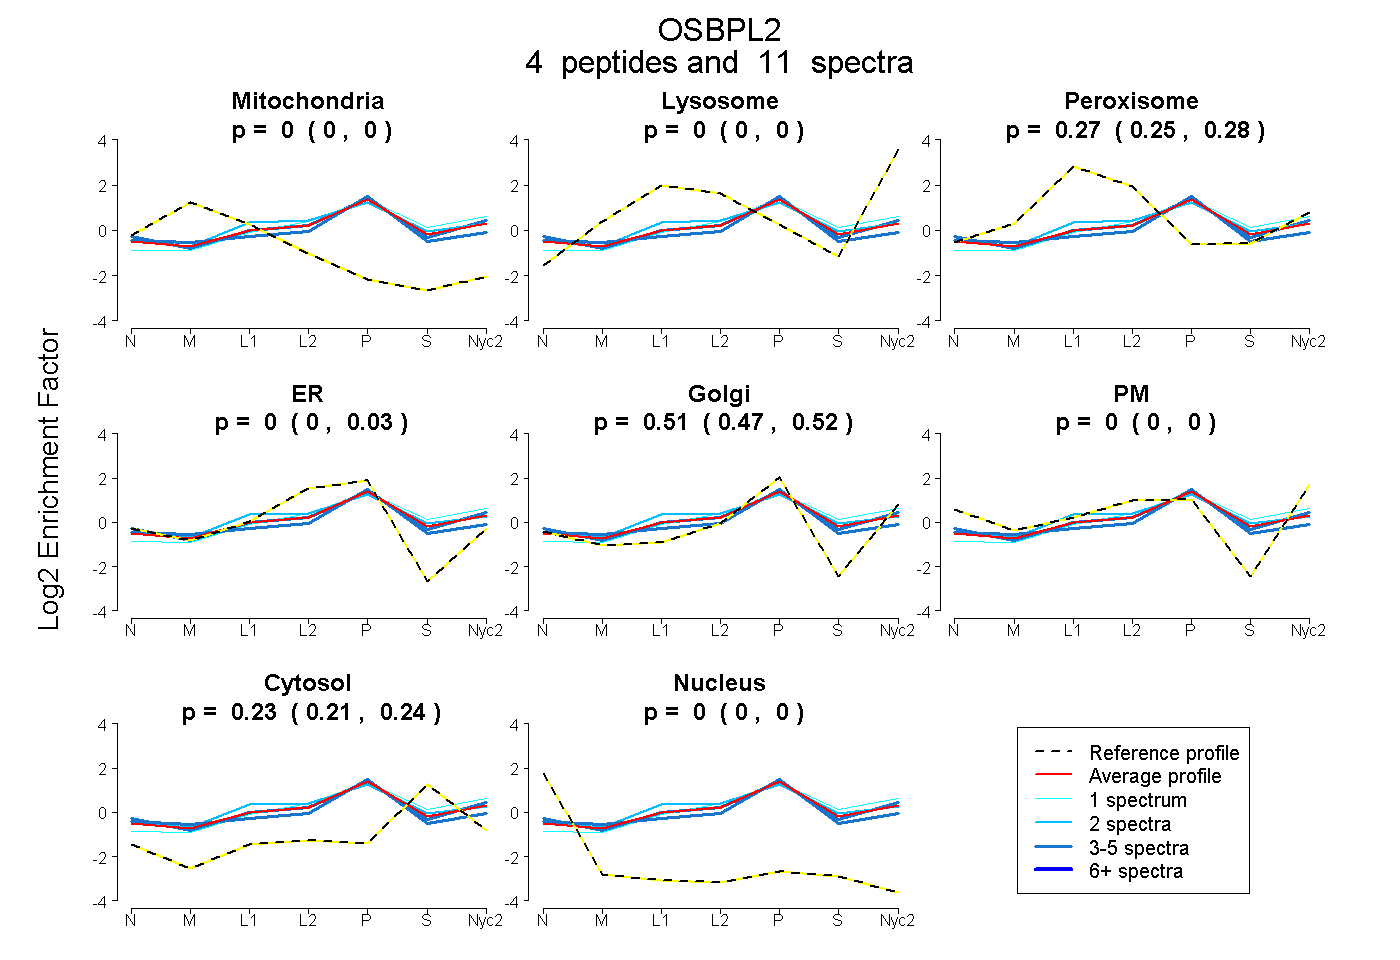
0.000 | 0.000
0.000 | 0.000
0.250 | 0.277
0.000 | 0.031
0.470 | 0.518
0.000 | 0.000
0.214 | 0.238
0.000 | 0.000
4peptides
spectra
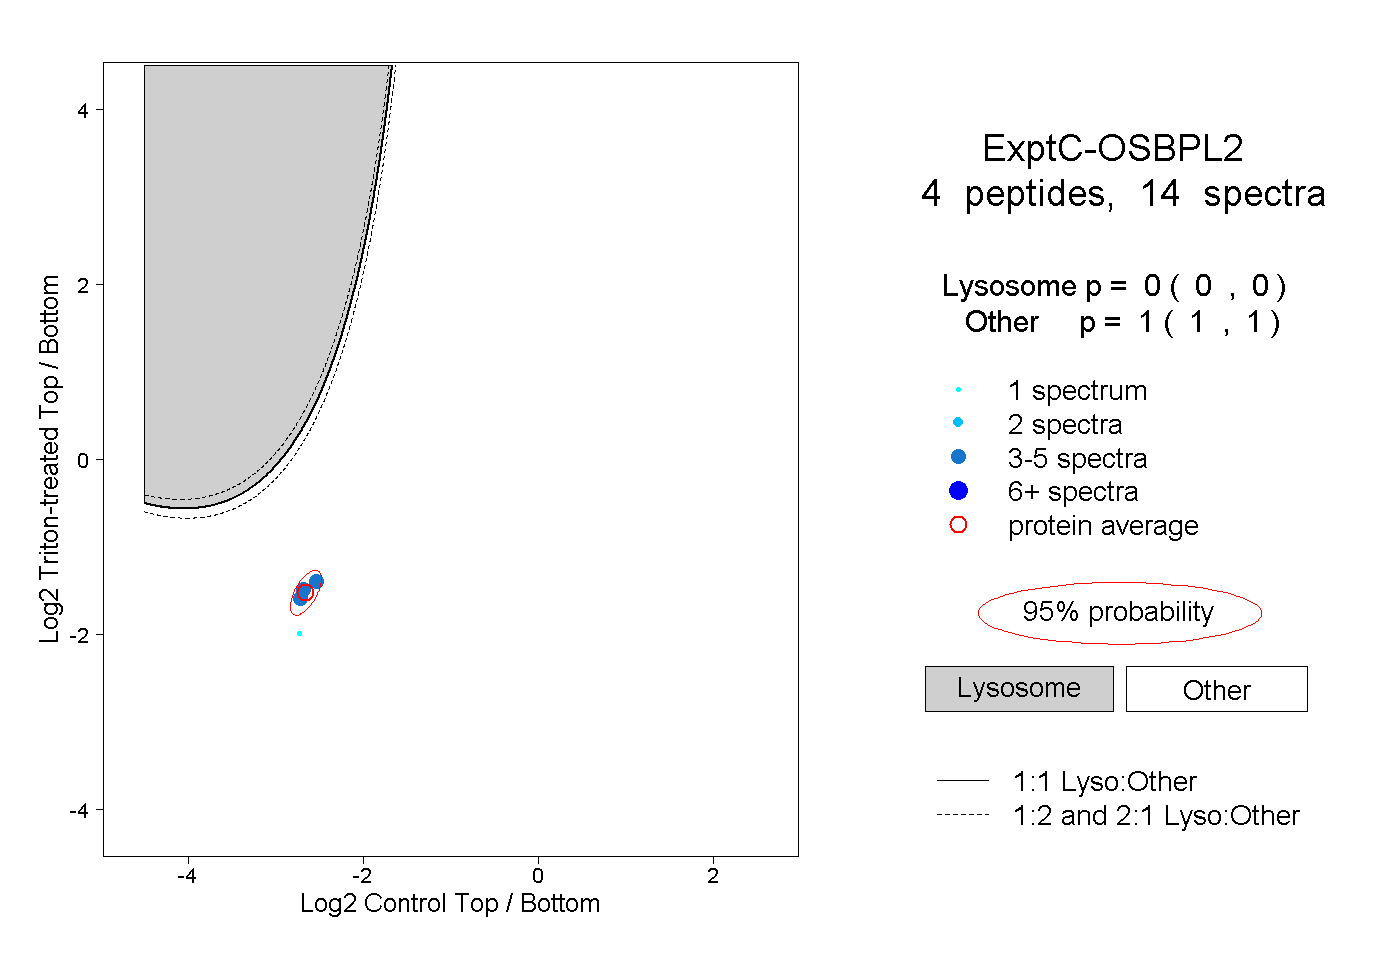
0.000 | 0.000
1.000 | 1.000
1peptide
spectra
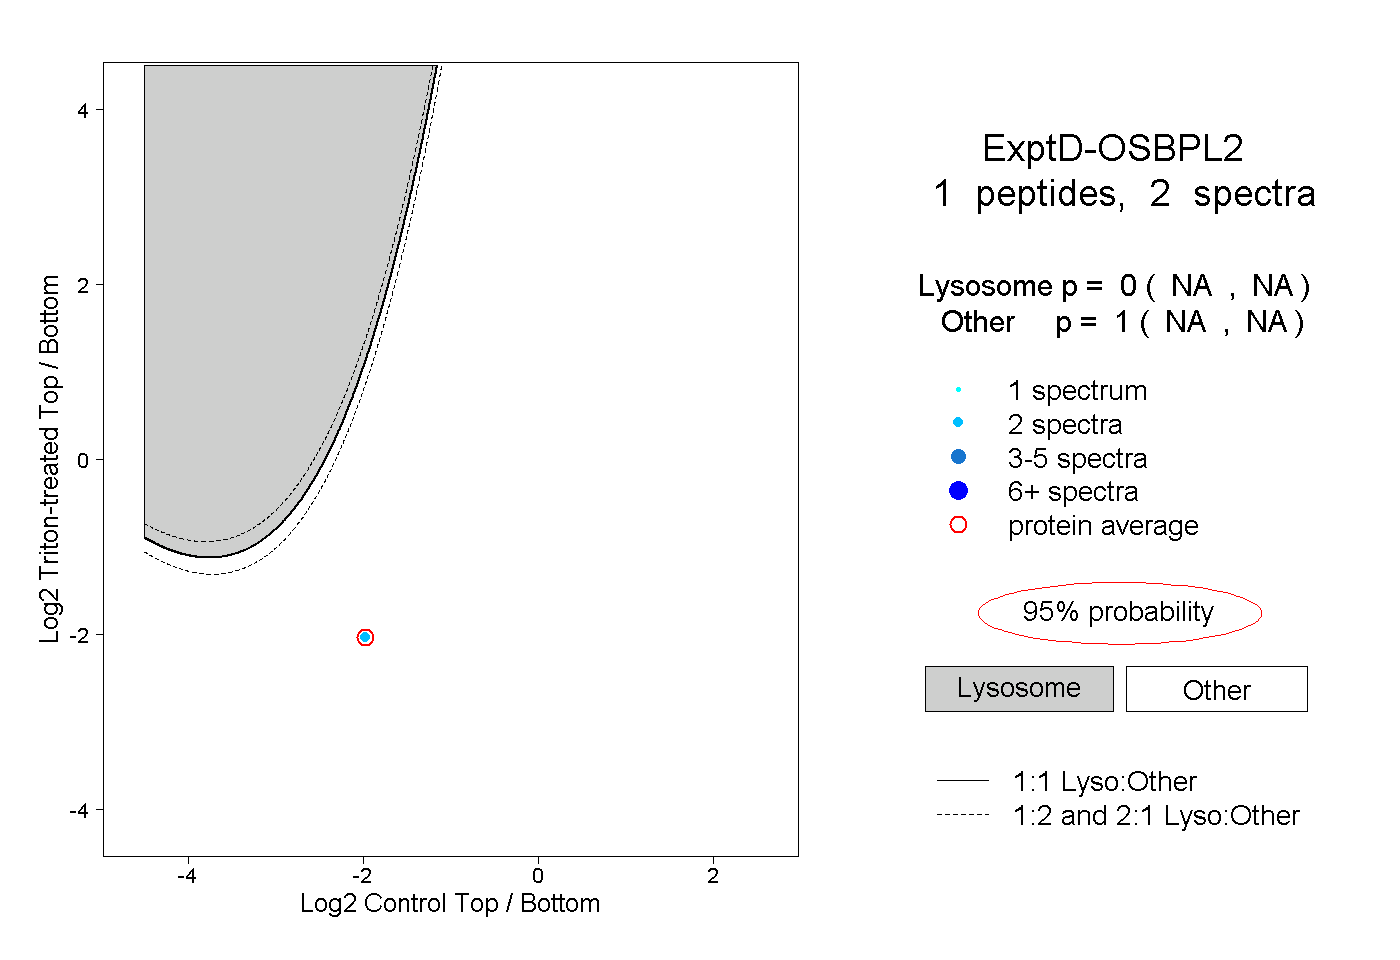
NA | NA
NA | NA