 4
4peptides
spectra
0.000 | 0.000
0.000 | 0.000
0.250 | 0.277
0.000 | 0.031
0.470 | 0.518
0.000 | 0.000
0.214 | 0.238
0.000 | 0.000
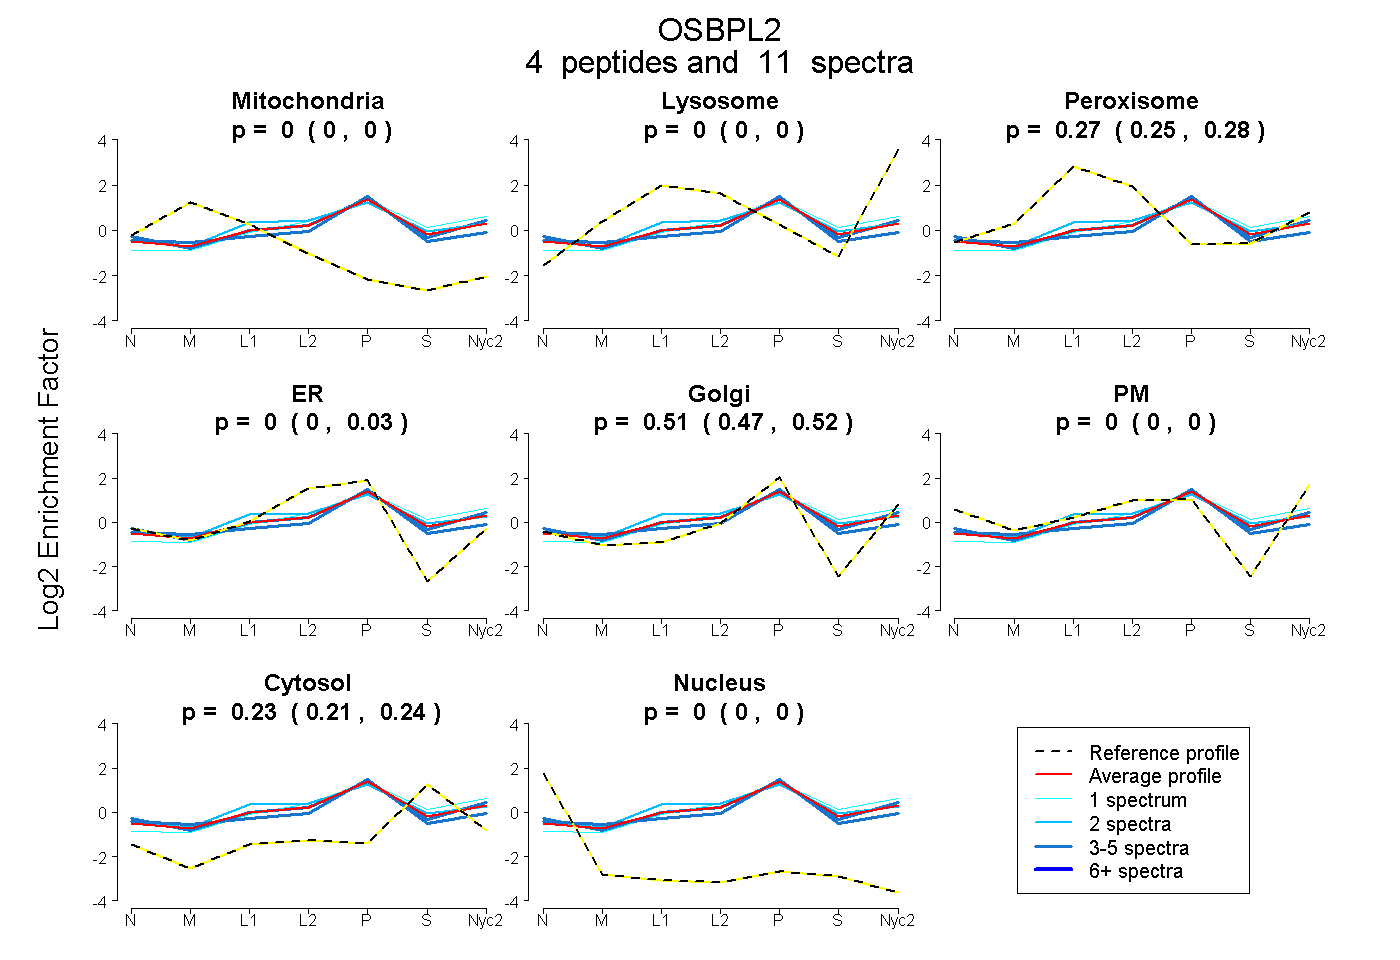
| Plot | Mito | Lyso | Perox | ER | Golgi | PM | Cytosol | Nucleus | |||||
| Expt A |
4 peptides |
11 spectra |
|
0.000 0.000 | 0.000 |
0.000 0.000 | 0.000 |
0.267 0.250 | 0.277 |
0.000 0.000 | 0.031 |
0.506 0.470 | 0.518 |
0.000 0.000 | 0.000 |
0.227 0.214 | 0.238 |
0.000 0.000 | 0.000 |
| 4 spectra, ASNQSQPLER | 0.000 | 0.000 | 0.262 | 0.000 | 0.535 | 0.000 | 0.203 | 0.000 | ||
| 2 spectra, SVEAEPR | 0.000 | 0.000 | 0.339 | 0.029 | 0.408 | 0.000 | 0.224 | 0.000 | ||
| 4 spectra, TALPAPMFTR | 0.000 | 0.000 | 0.164 | 0.110 | 0.485 | 0.000 | 0.240 | 0.000 | ||
| 1 spectrum, ITEYMEHVYLIHR | 0.000 | 0.205 | 0.059 | 0.154 | 0.258 | 0.000 | 0.324 | 0.000 |
| Plot | Lyso | Other | |||||||||||
| Expt C |
4 peptides |
14 spectra |
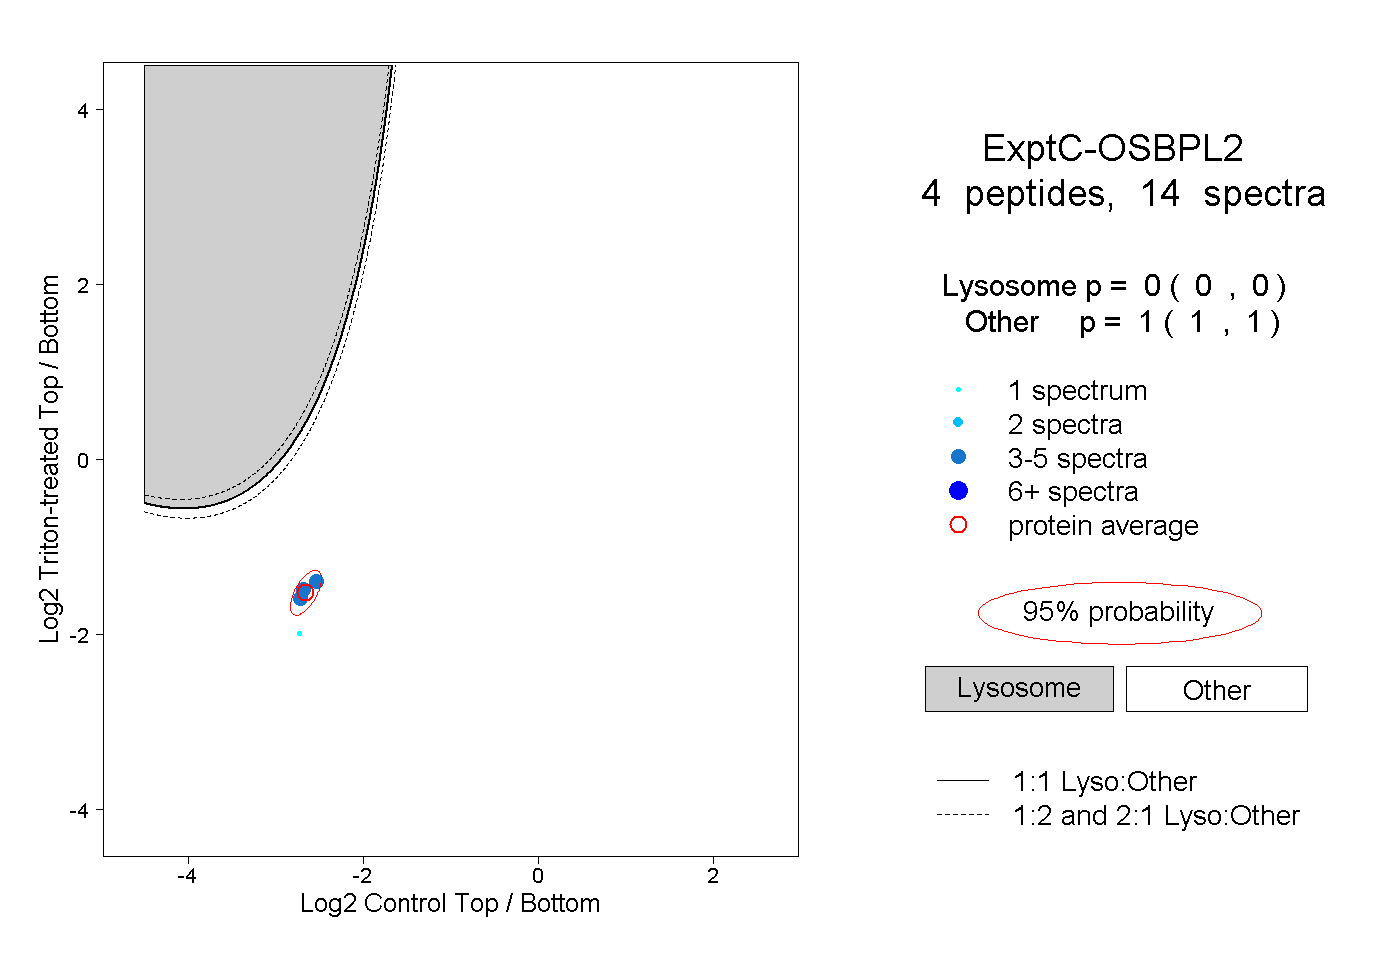 |
0.000 0.000 | 0.000 |
1.000 1.000 | 1.000 |
||||||||
| Plot | Lyso | Other | |||||||||||
| Expt D |
1 peptide |
2 spectra |
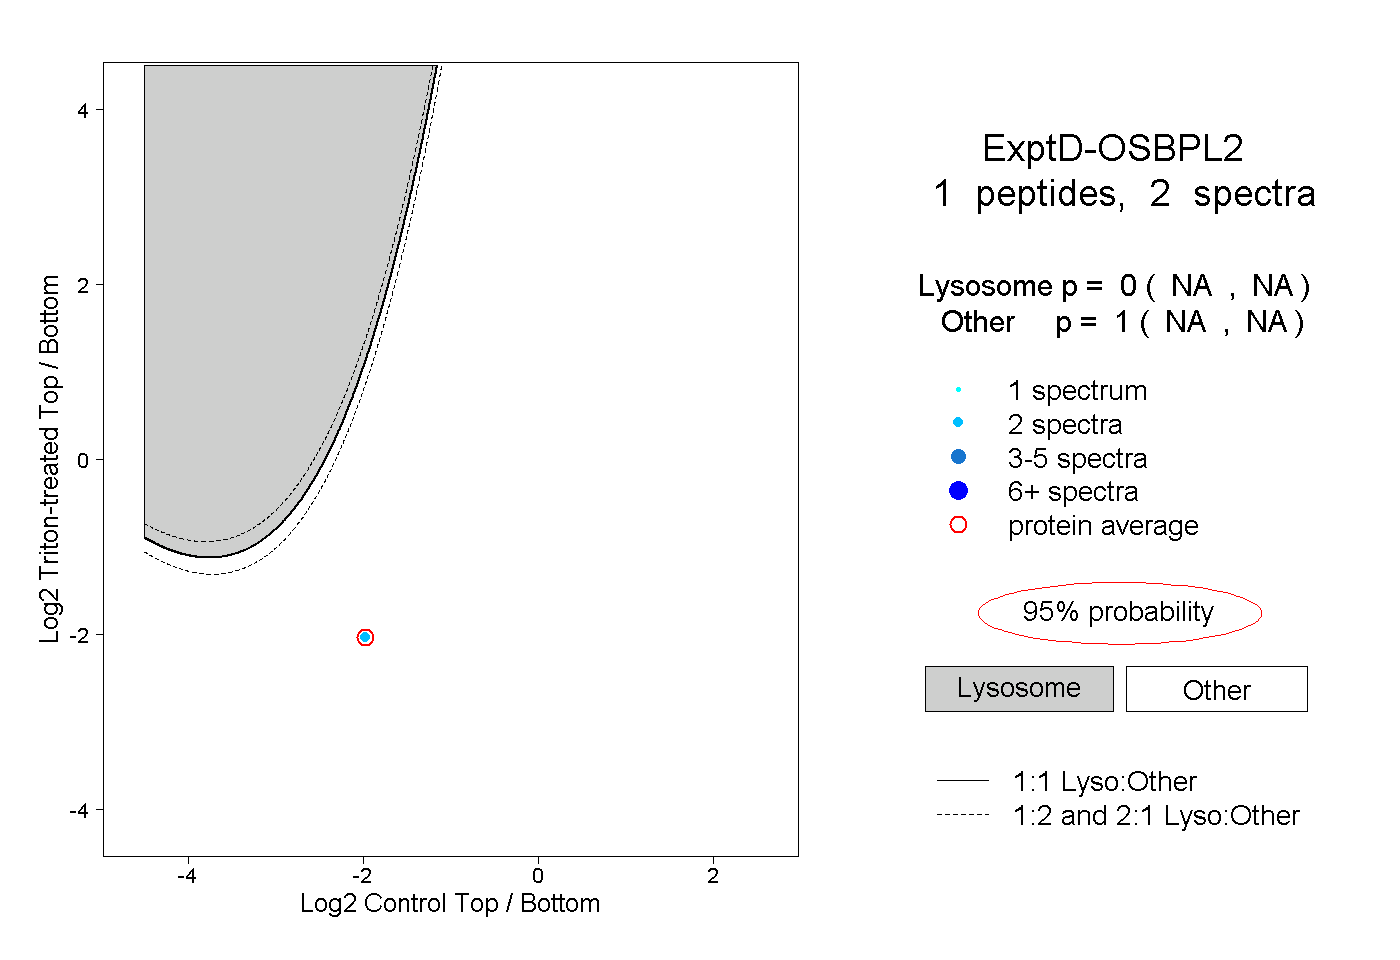 |
0.000 NA | NA |
1.000 NA | NA |