 5
5peptides
spectra
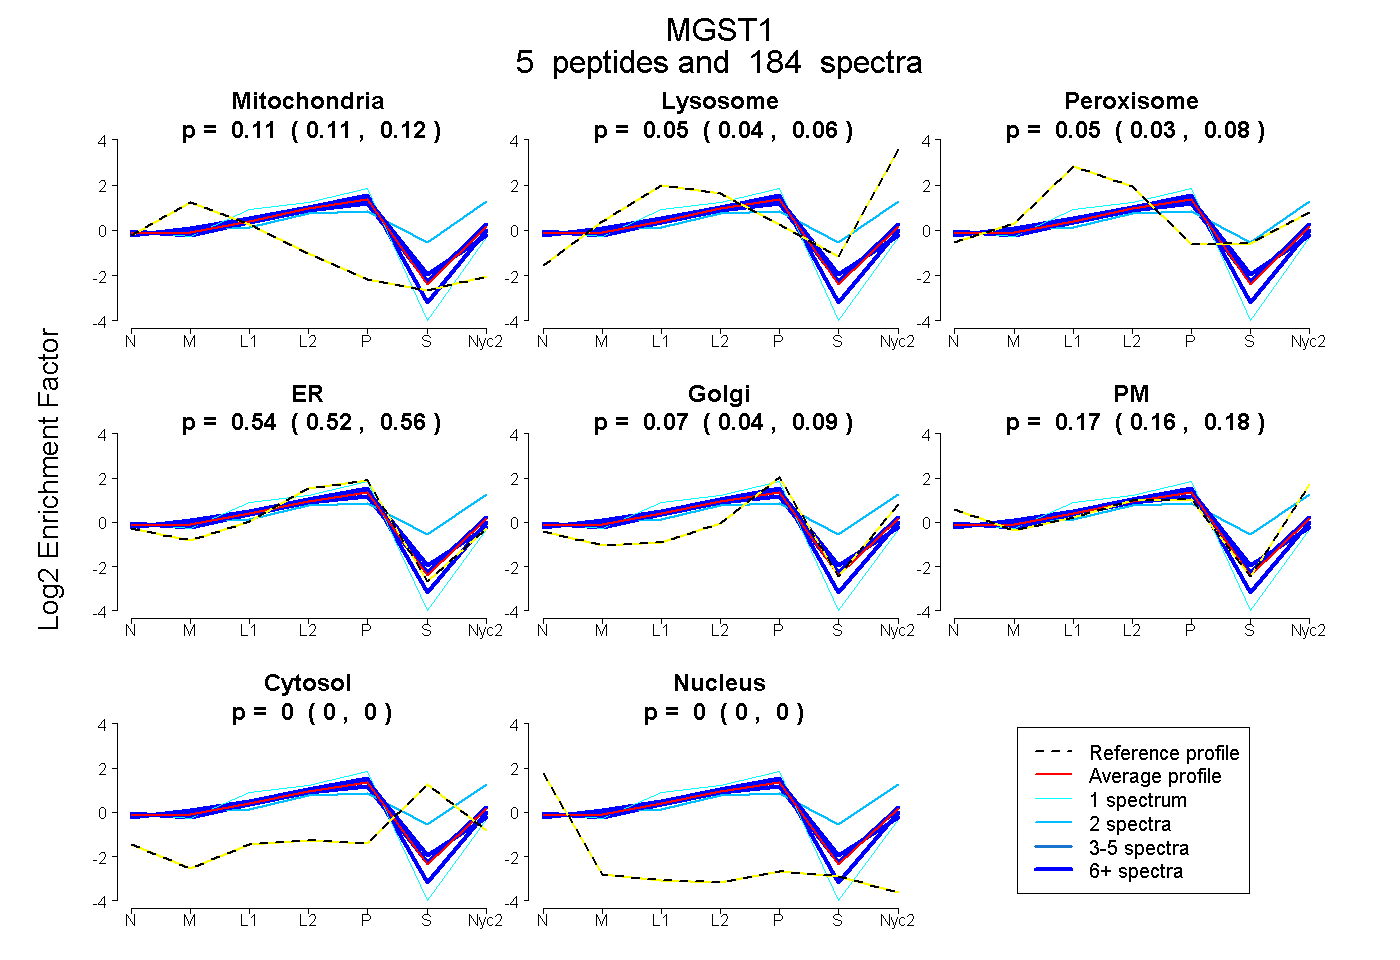
0.105 | 0.120
0.036 | 0.063
0.027 | 0.076
0.515 | 0.561
0.042 | 0.095
0.158 | 0.182
0.000 | 0.000
0.000 | 0.000
4peptides
spectra
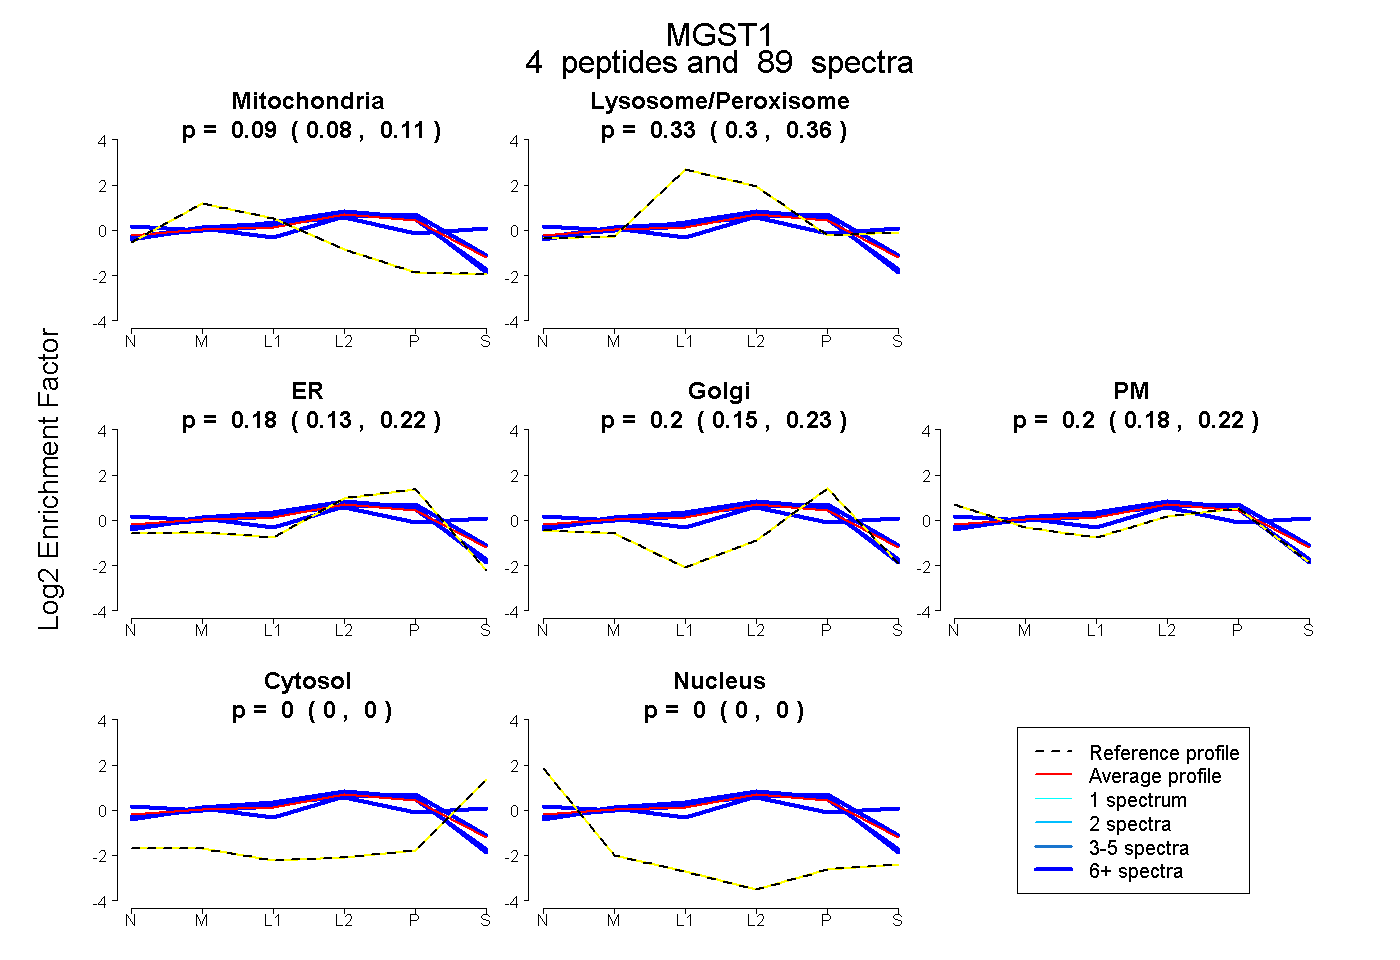
0.077 | 0.108
0.304 | 0.357
0.126 | 0.216
0.153 | 0.233
0.177 | 0.219
0.000 | 0.002
0.000 | 0.000
6peptides
spectra
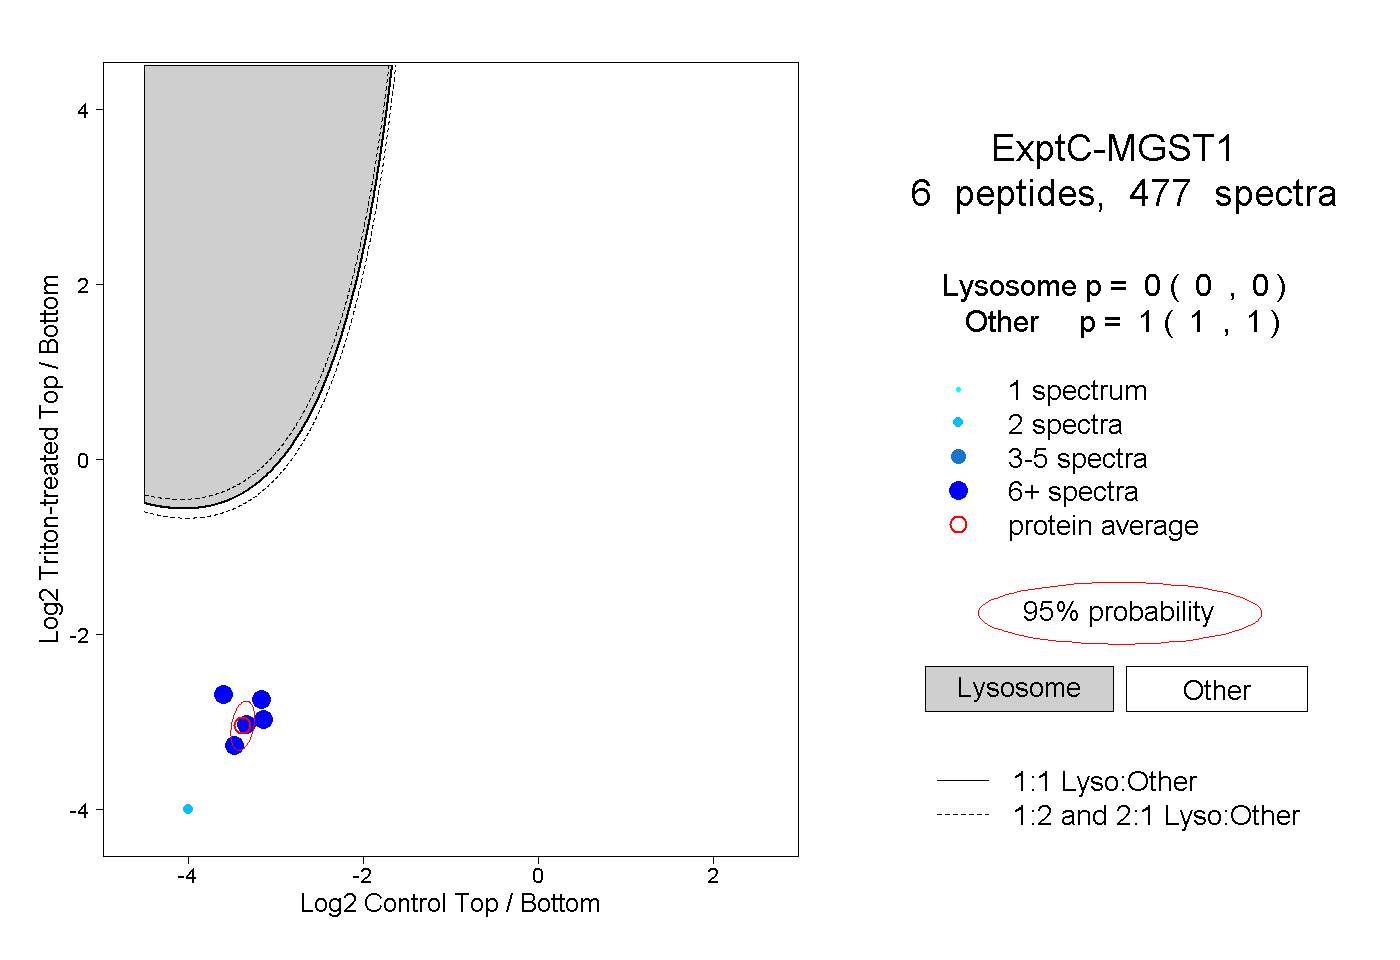
0.000 | 0.000
1.000 | 1.000
4peptides
spectra
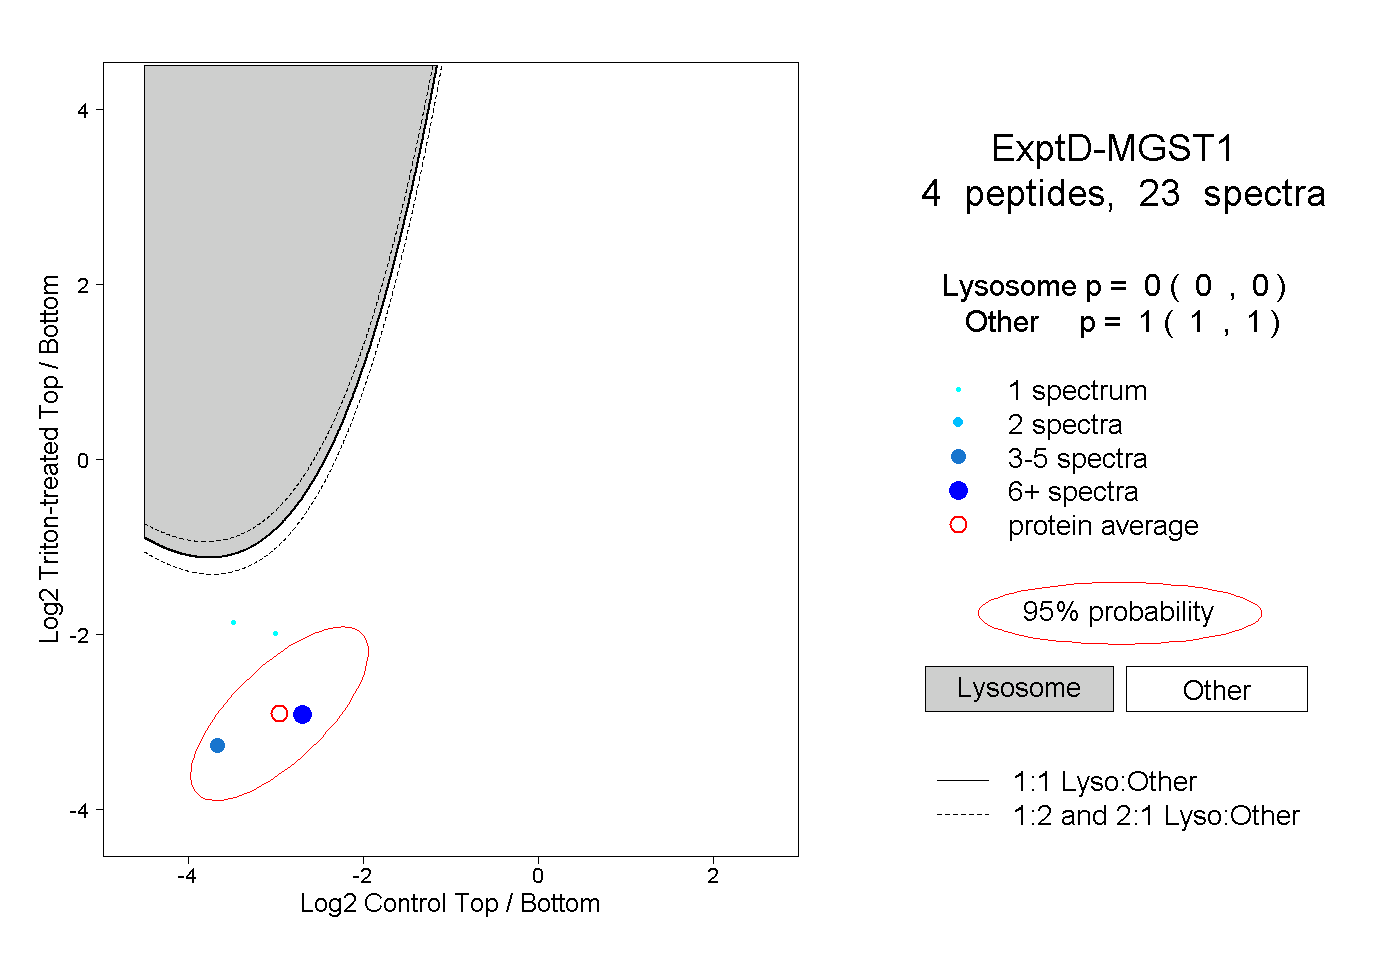
0.000 | 0.000
1.000 | 1.000