 5
5peptides
spectra
0.105 | 0.120
0.036 | 0.063
0.027 | 0.076
0.515 | 0.561
0.042 | 0.095
0.158 | 0.182
0.000 | 0.000
0.000 | 0.000
| Plot | Mito | Lyso | Perox | ER | Golgi | PM | Cytosol | Nucleus | |||||
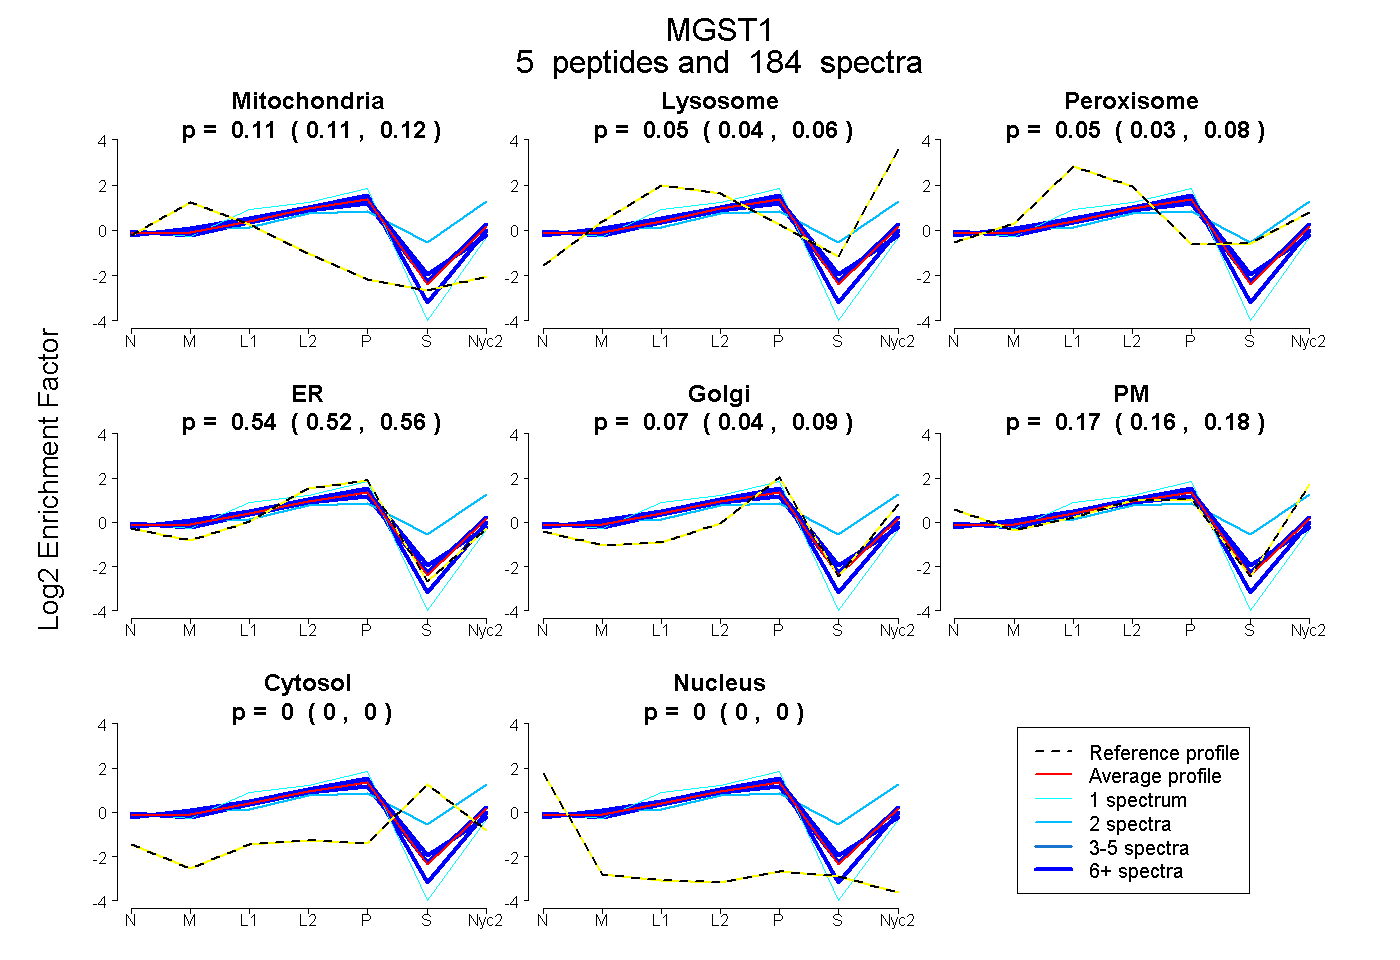
| Expt A |
5 peptides |
184 spectra |
|
0.113 0.105 | 0.120 |
0.051 0.036 | 0.063 |
0.053 0.027 | 0.076 |
0.540 0.515 | 0.561 |
0.071 0.042 | 0.095 |
0.171 0.158 | 0.182 |
0.000 0.000 | 0.000 |
0.000 0.000 | 0.000 |
| 63 spectra, VFANPEDCAGFGK | 0.108 | 0.000 | 0.166 | 0.540 | 0.186 | 0.000 | 0.000 | 0.000 | ||
| 1 spectrum, QLMDNEVLMAFTSYATIILAK | 0.073 | 0.000 | 0.000 | 0.891 | 0.000 | 0.035 | 0.000 | 0.000 | ||
| 61 spectra, MMFLSSATAFQR | 0.125 | 0.036 | 0.000 | 0.676 | 0.000 | 0.162 | 0.000 | 0.000 | ||
| 57 spectra, IFVGAR | 0.104 | 0.000 | 0.116 | 0.406 | 0.150 | 0.223 | 0.000 | 0.000 | ||
| 2 spectra, IYHTIAYLTPLPQPNR | 0.000 | 0.172 | 0.163 | 0.000 | 0.176 | 0.319 | 0.170 | 0.000 |
| Plot | Mito | Lyso or Perox | ER | Golgi | PM | Cytosol | Nucleus | ||||||
| Expt B |
4 peptides |
89 spectra |
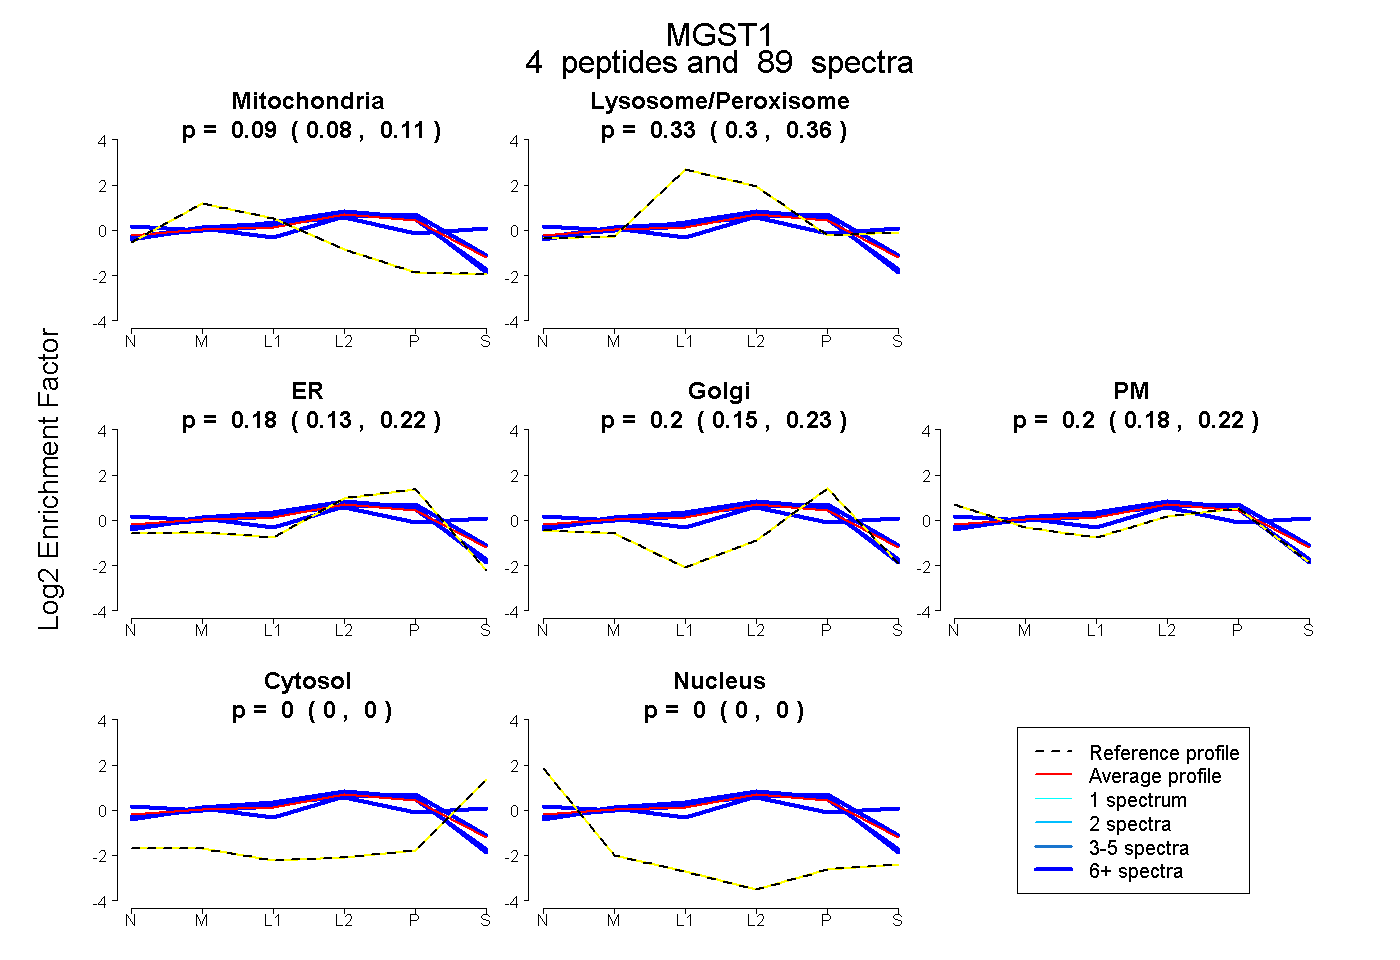 |
0.095 0.077 | 0.108 |
0.333 0.304 | 0.357 |
0.175 0.126 | 0.216 |
0.198 0.153 | 0.233 |
0.199 0.177 | 0.219 |
0.000 0.000 | 0.002 |
0.000 0.000 | 0.000 |
|||
| Plot | Lyso | Other | |||||||||||
| Expt C |
6 peptides |
477 spectra |
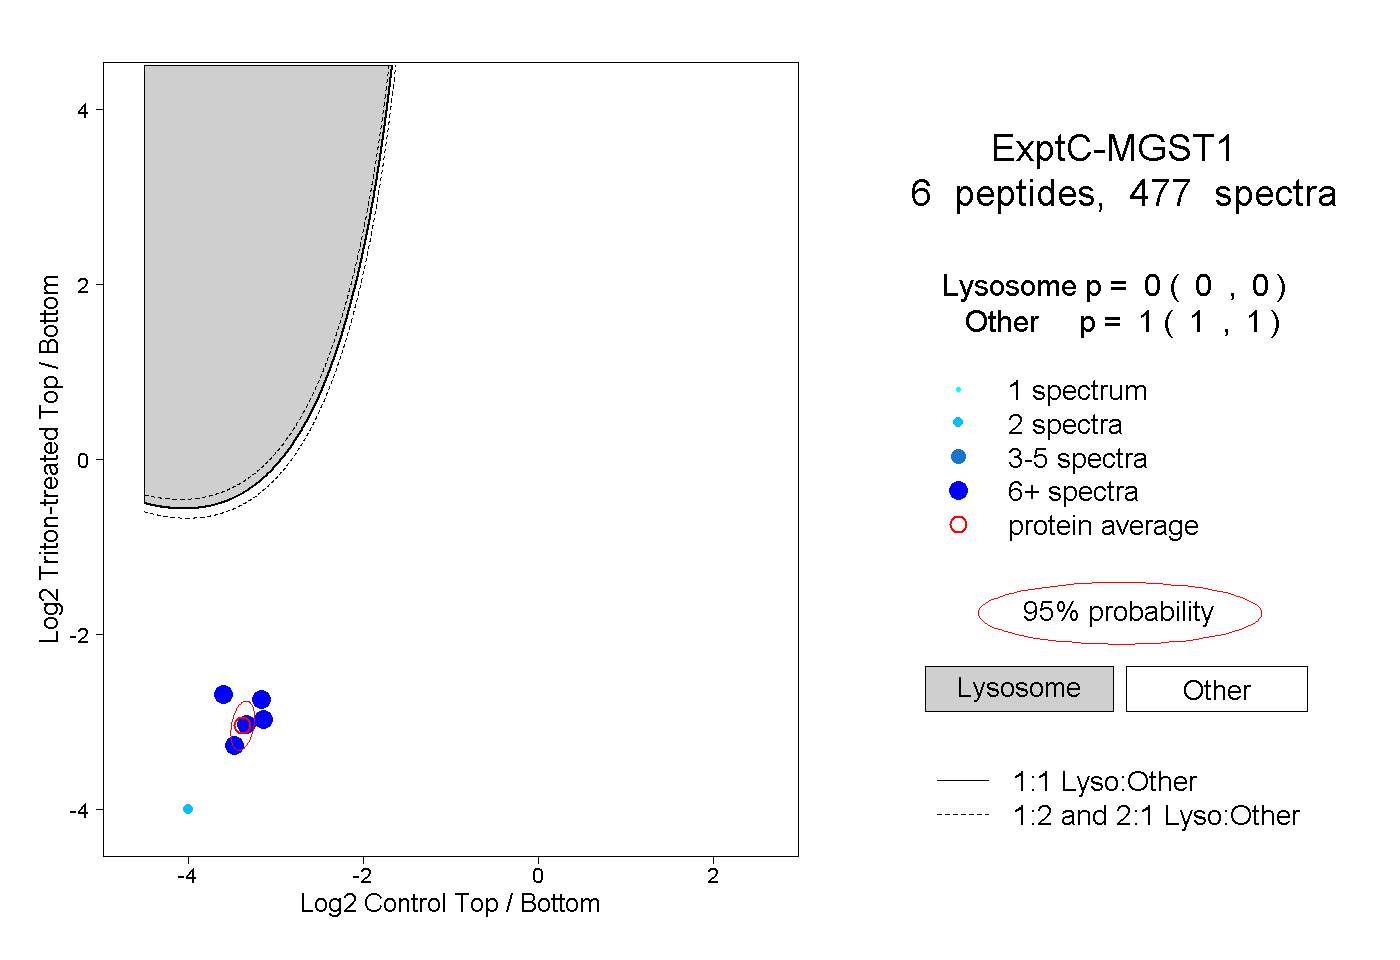 |
0.000 0.000 | 0.000 |
1.000 1.000 | 1.000 |
||||||||
| Plot | Lyso | Other | |||||||||||
| Expt D |
4 peptides |
23 spectra |
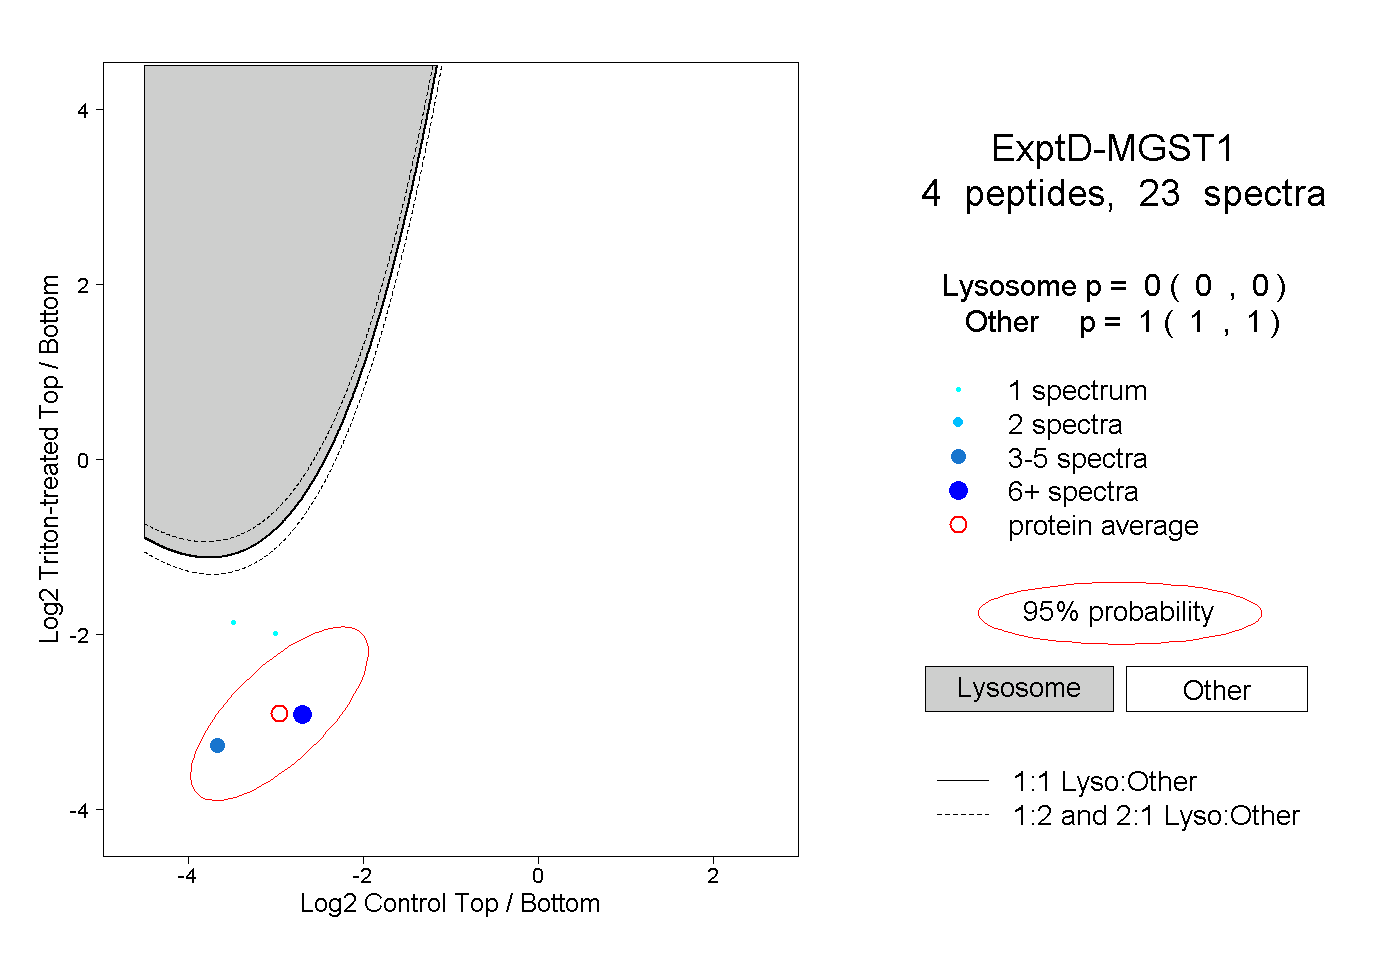 |
0.000 0.000 | 0.000 |
1.000 1.000 | 1.000 |