 6
6peptides
spectra
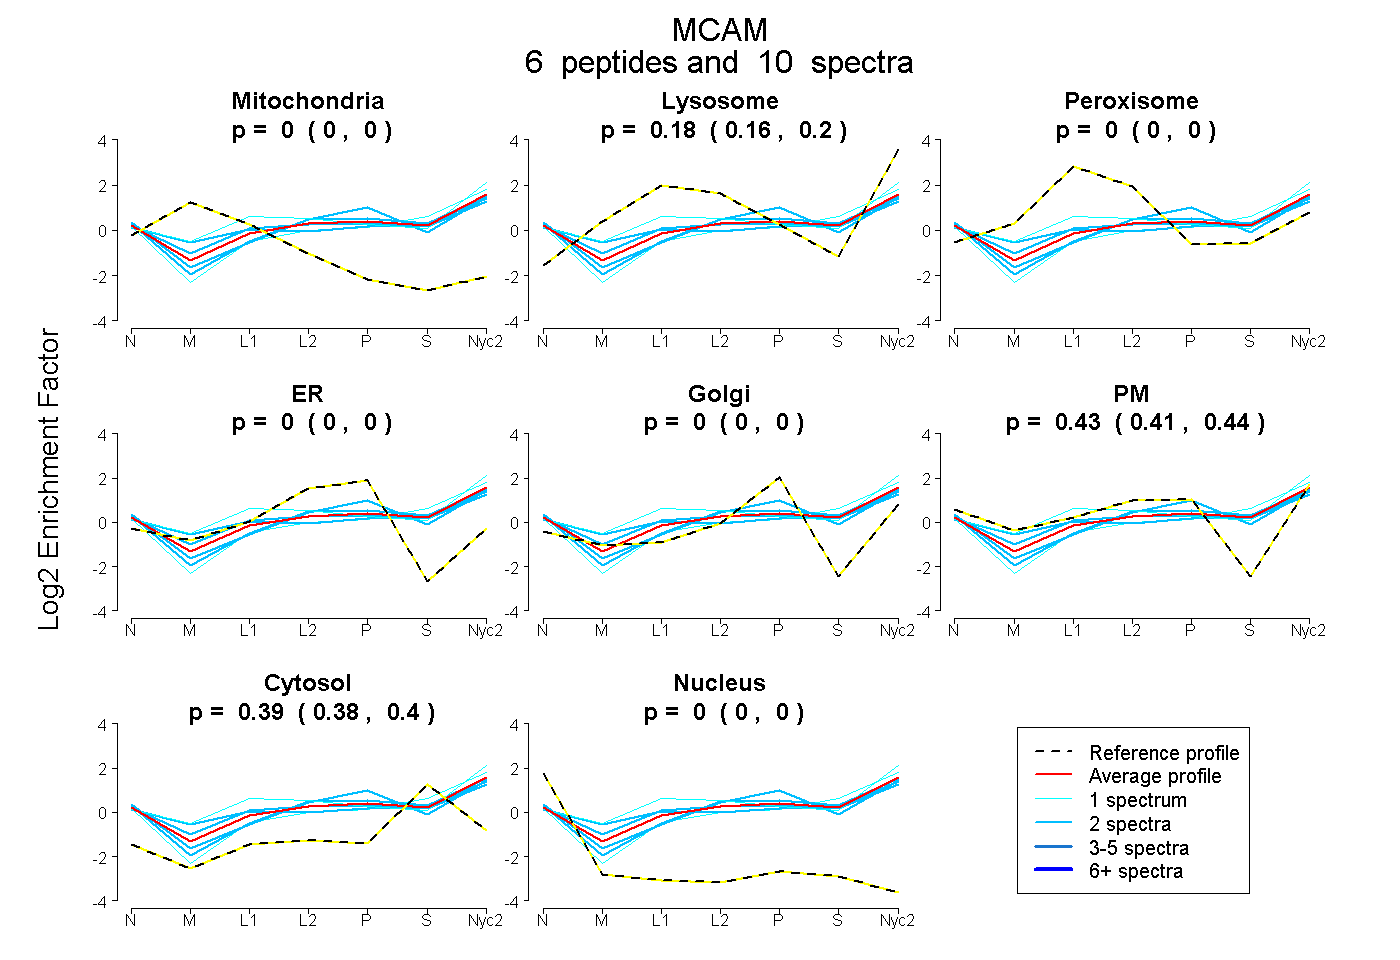
0.000 | 0.000
0.160 | 0.199
0.000 | 0.000
0.000 | 0.000
0.000 | 0.000
0.407 | 0.440
0.379 | 0.404
0.000 | 0.000
5peptides
spectra
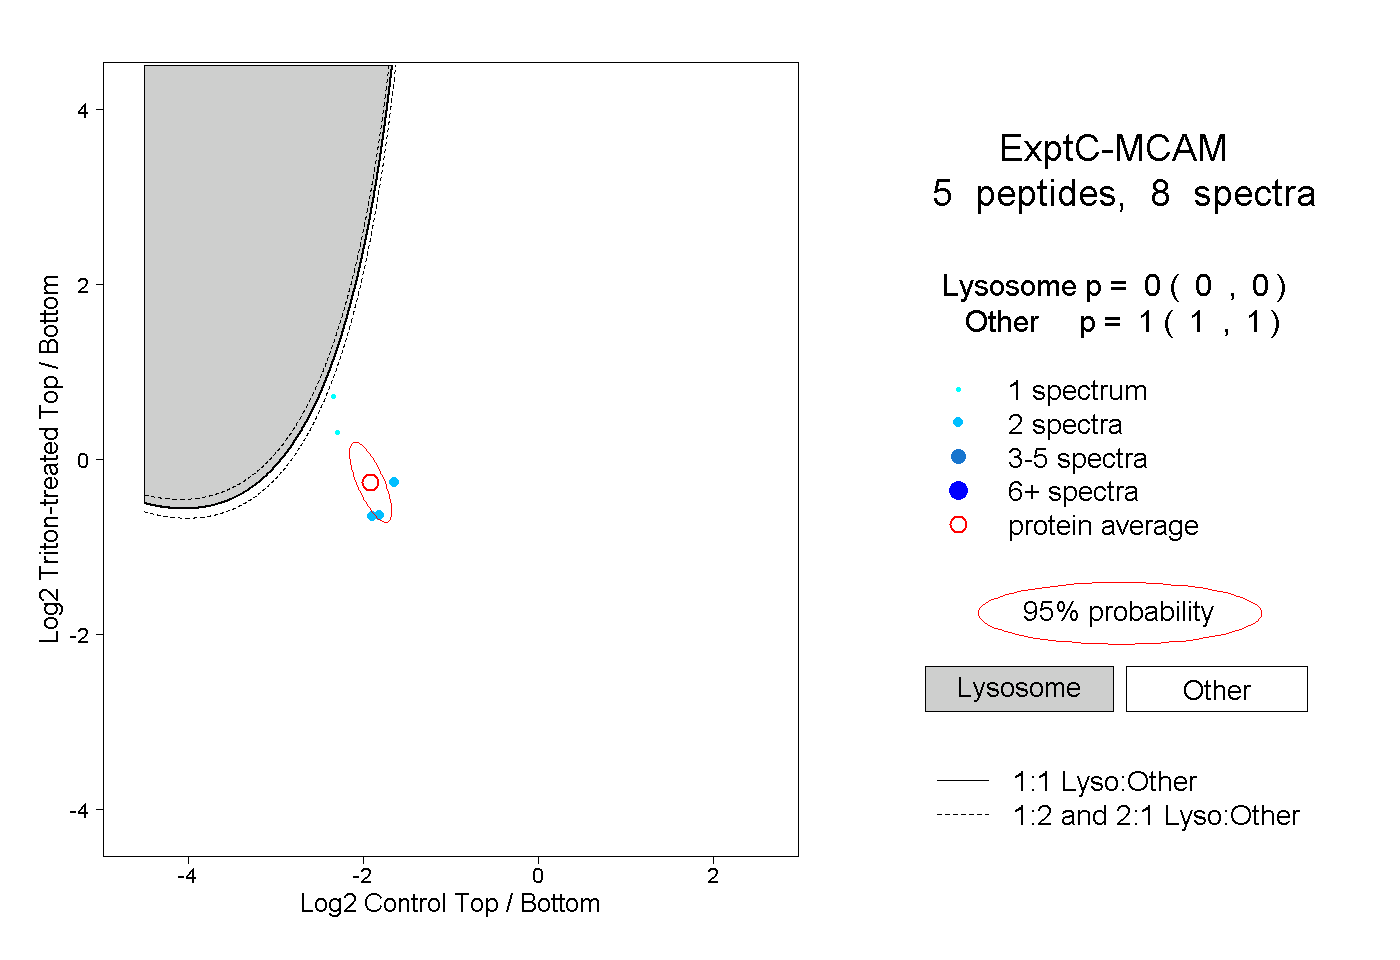
0.000 | 0.000
1.000 | 1.000
| Plot | Mito | Lyso | Perox | ER | Golgi | PM | Cytosol | Nucleus | |||||
| Expt A |
6 peptides |
10 spectra |
|
0.000 0.000 | 0.000 |
0.181 0.160 | 0.199 |
0.000 0.000 | 0.000 |
0.000 0.000 | 0.000 |
0.000 0.000 | 0.000 |
0.426 0.407 | 0.440 |
0.393 0.379 | 0.404 |
0.000 0.000 | 0.000 |
||
| Plot | Lyso | Other | |||||||||||
| Expt C |
5 peptides |
8 spectra |
|
0.000 0.000 | 0.000 |
1.000 1.000 | 1.000 |