 6
6peptides
spectra
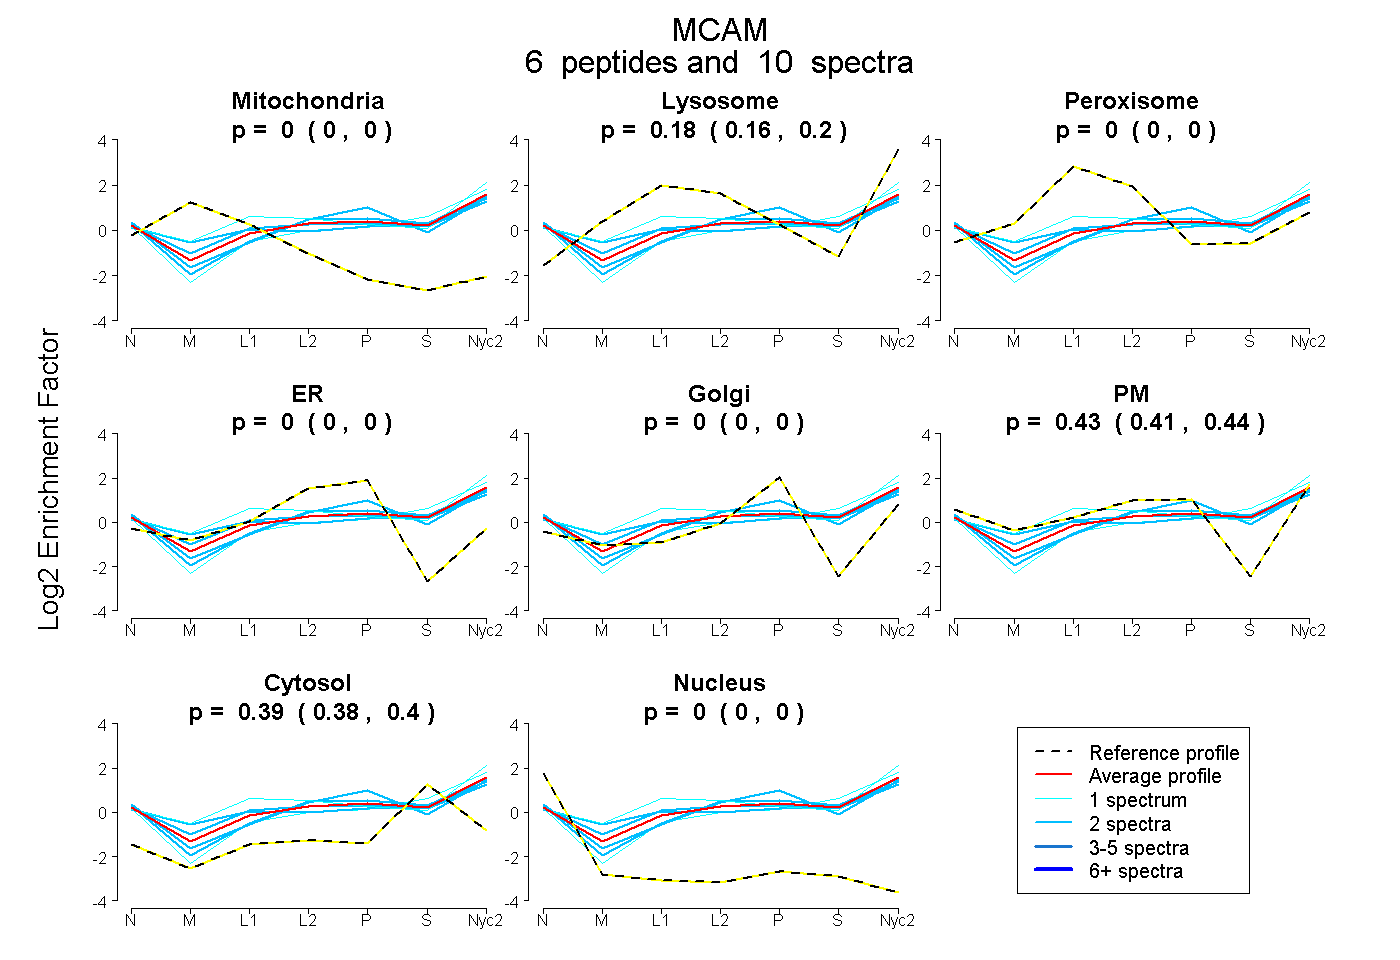
0.000 | 0.000
0.160 | 0.199
0.000 | 0.000
0.000 | 0.000
0.000 | 0.000
0.407 | 0.440
0.379 | 0.404
0.000 | 0.000
| Plot | Mito | Lyso | Perox | ER | Golgi | PM | Cytosol | Nucleus | |||||
| Expt A |
6 peptides |
10 spectra |
|
0.000 0.000 | 0.000 |
0.181 0.160 | 0.199 |
0.000 0.000 | 0.000 |
0.000 0.000 | 0.000 |
0.000 0.000 | 0.000 |
0.426 0.407 | 0.440 |
0.393 0.379 | 0.404 |
0.000 0.000 | 0.000 |
| 1 spectrum, AESNQDLEFEWLR | 0.000 | 0.159 | 0.000 | 0.000 | 0.000 | 0.333 | 0.508 | 0.000 | ||
| 2 spectra, GQSEPGEYEHR | 0.000 | 0.092 | 0.000 | 0.000 | 0.000 | 0.479 | 0.429 | 0.000 | ||
| 2 spectra, EVTVPVLYPAEK | 0.000 | 0.166 | 0.072 | 0.000 | 0.000 | 0.380 | 0.381 | 0.000 | ||
| 2 spectra, EVATCVGR | 0.000 | 0.179 | 0.053 | 0.000 | 0.000 | 0.385 | 0.382 | 0.000 | ||
| 1 spectrum, VWVEVEPVGLLK | 0.000 | 0.381 | 0.051 | 0.000 | 0.000 | 0.303 | 0.266 | 0.000 | ||
| 2 spectra, QIPIFR | 0.000 | 0.037 | 0.000 | 0.000 | 0.033 | 0.581 | 0.350 | 0.000 |
| Plot | Lyso | Other | |||||||||||
| Expt C |
5 peptides |
8 spectra |
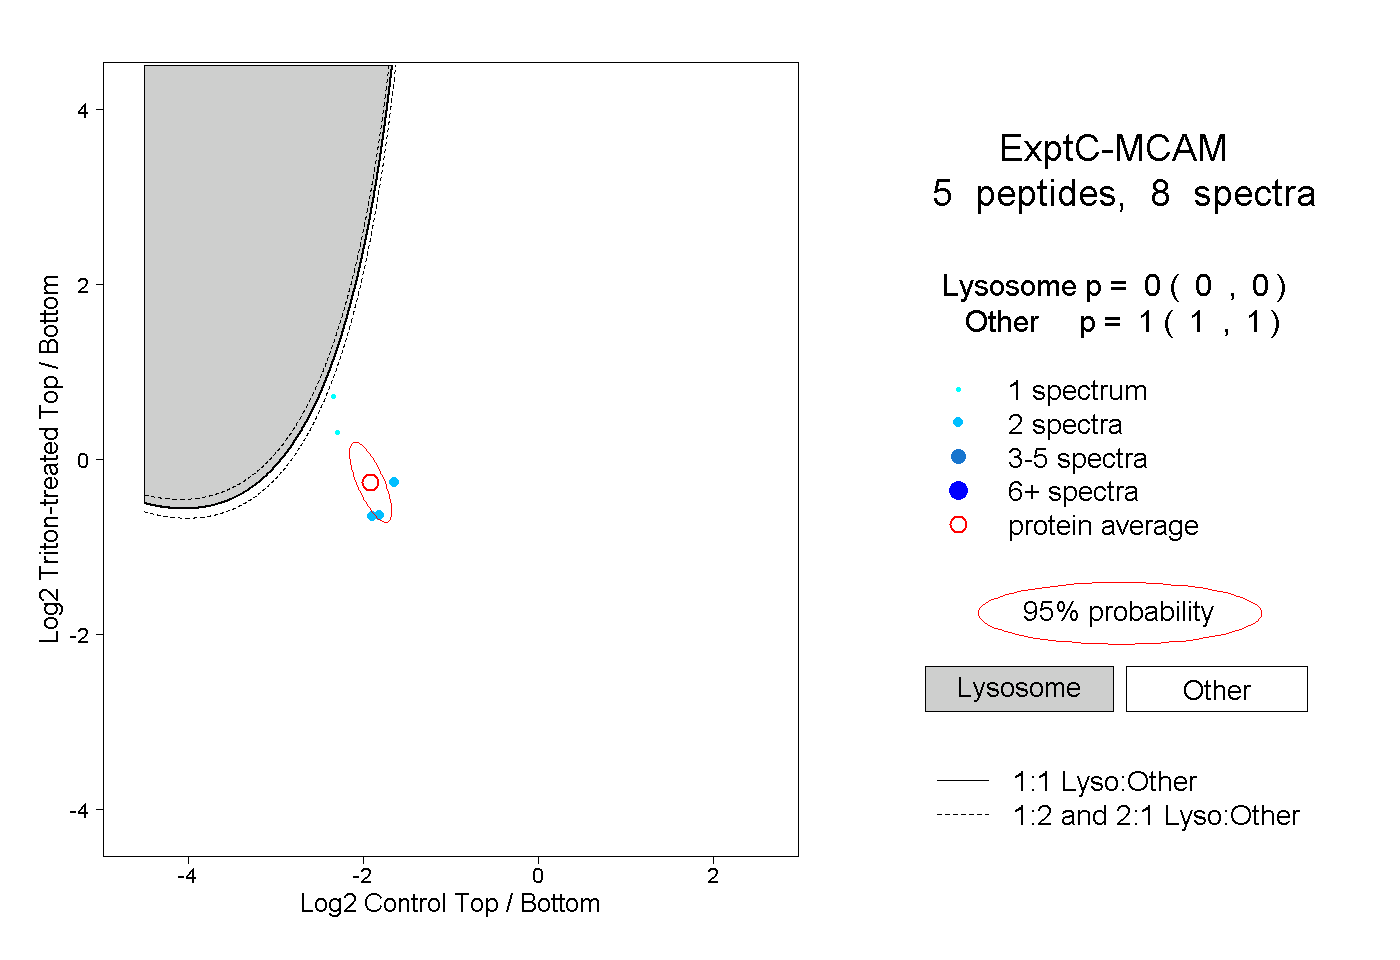 |
0.000 0.000 | 0.000 |
1.000 1.000 | 1.000 |