 12
12peptides
spectra
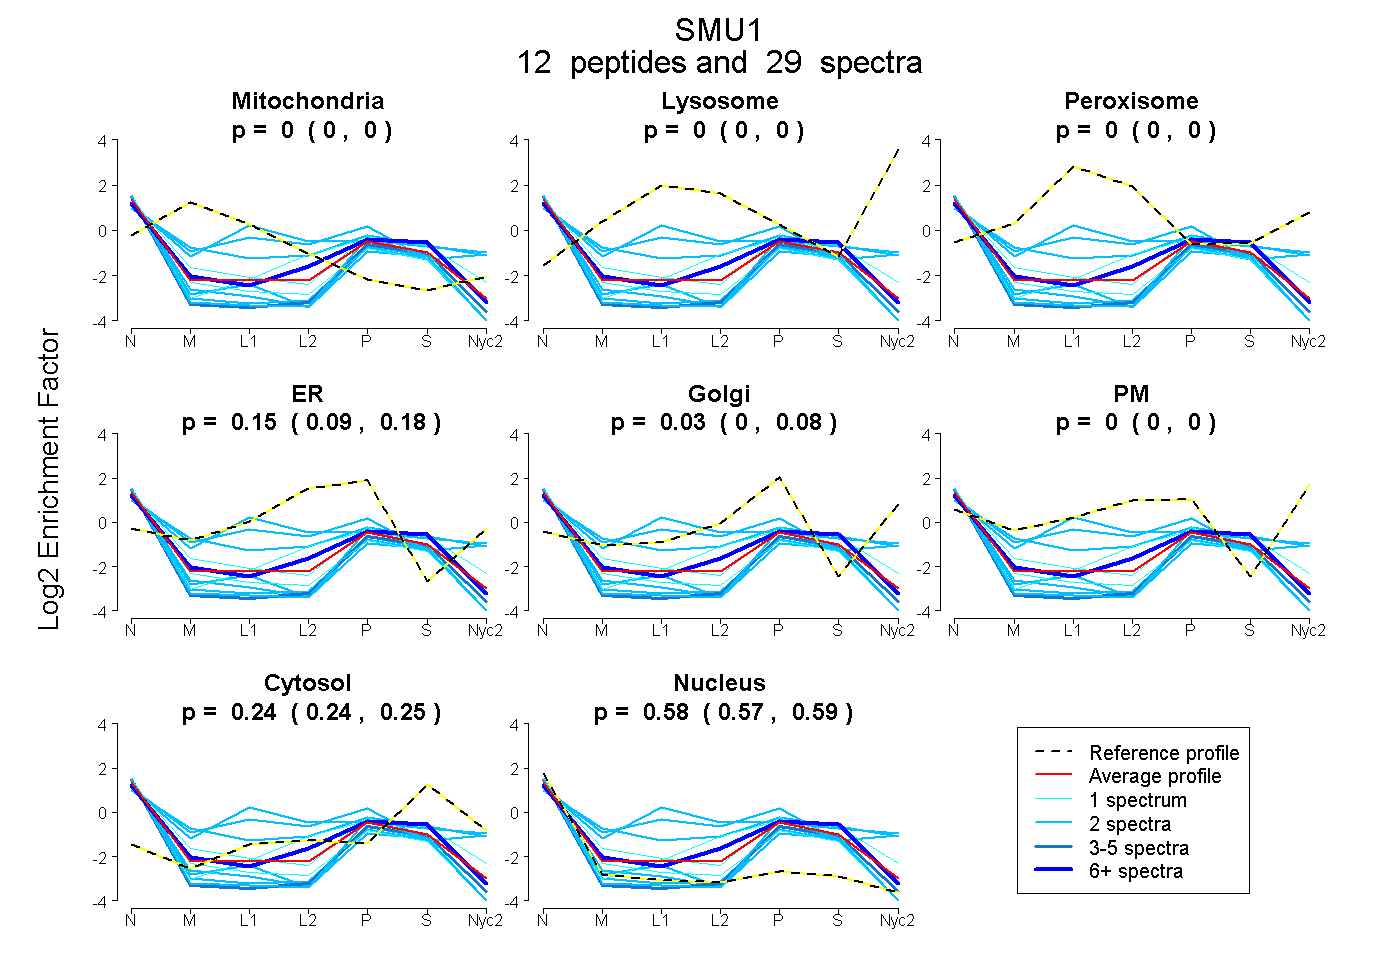
0.000 | 0.000
0.000 | 0.000
0.000 | 0.000
0.093 | 0.181
0.000 | 0.080
0.000 | 0.000
0.235 | 0.249
0.567 | 0.590
3peptides
spectra
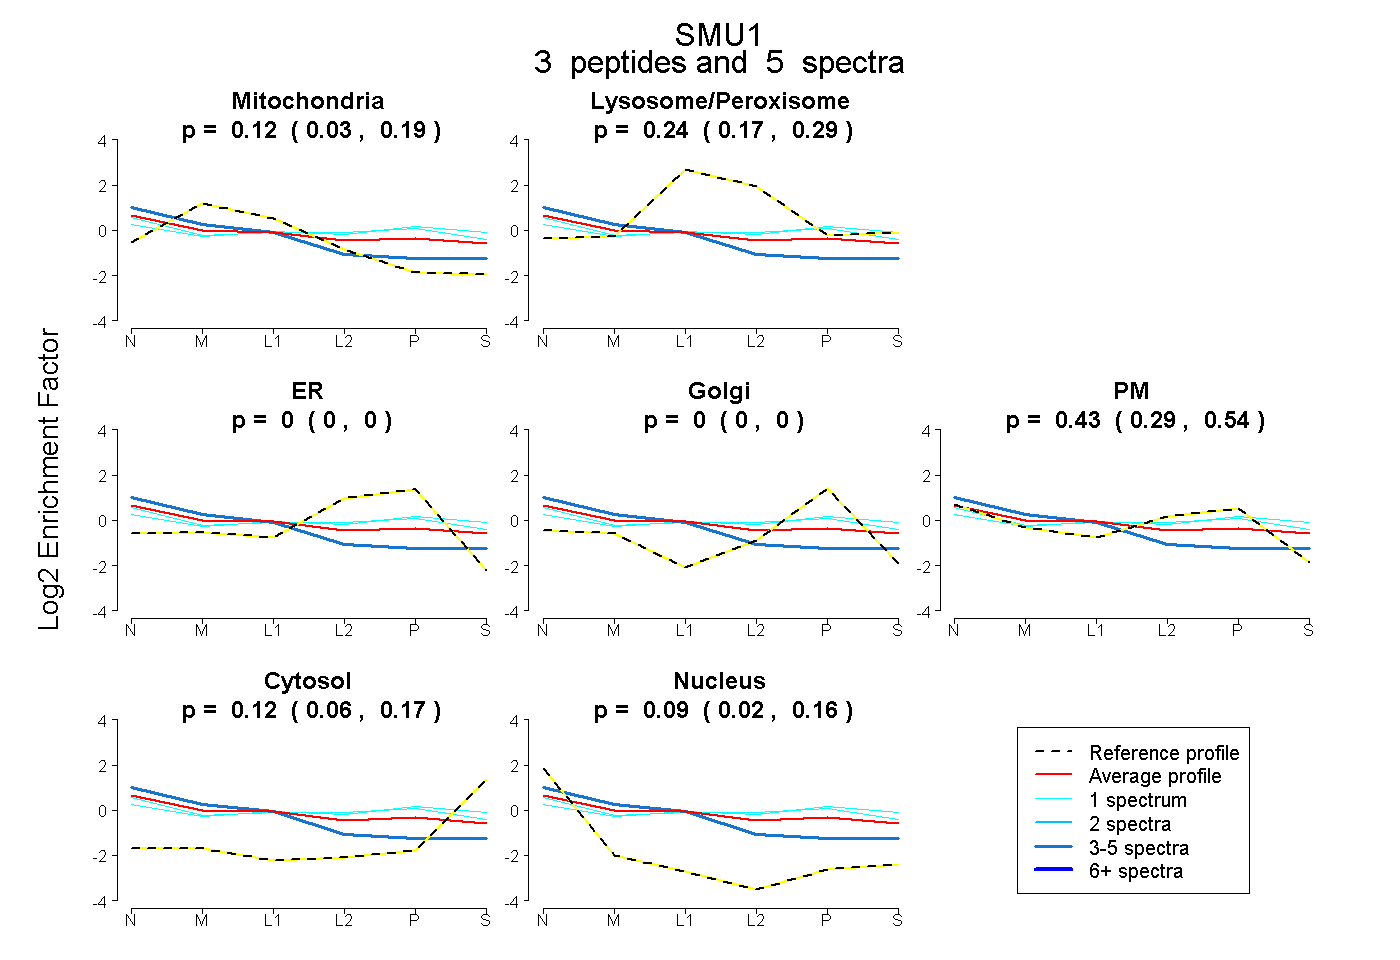
0.032 | 0.191
0.169 | 0.290
0.000 | 0.000
0.000 | 0.000
0.292 | 0.541
0.065 | 0.170
0.019 | 0.156
2peptides
spectra
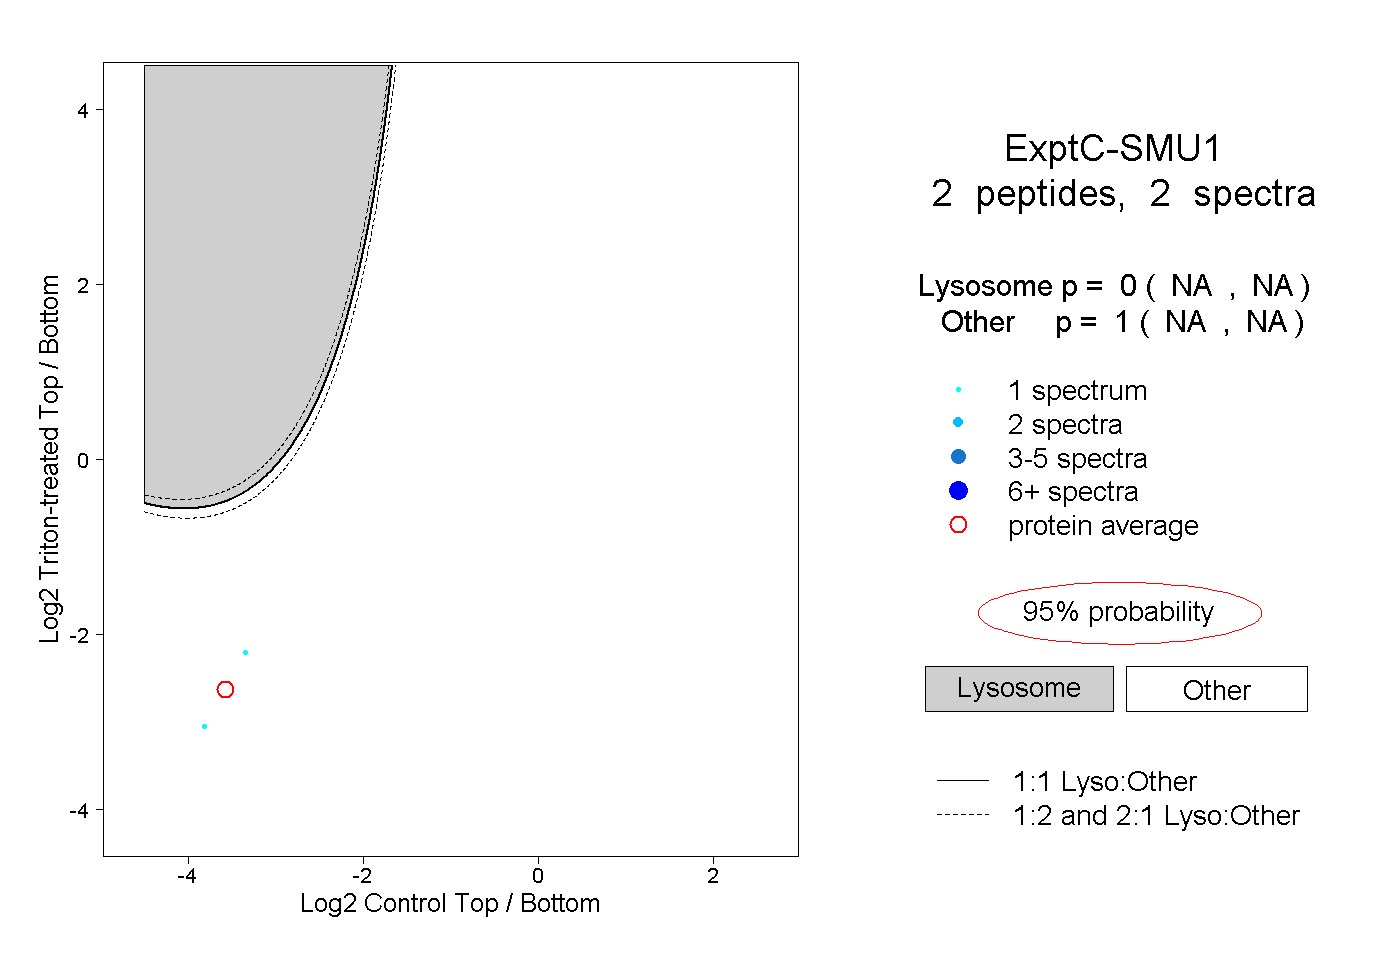
NA | NA
NA | NA