 19
19peptides
spectra
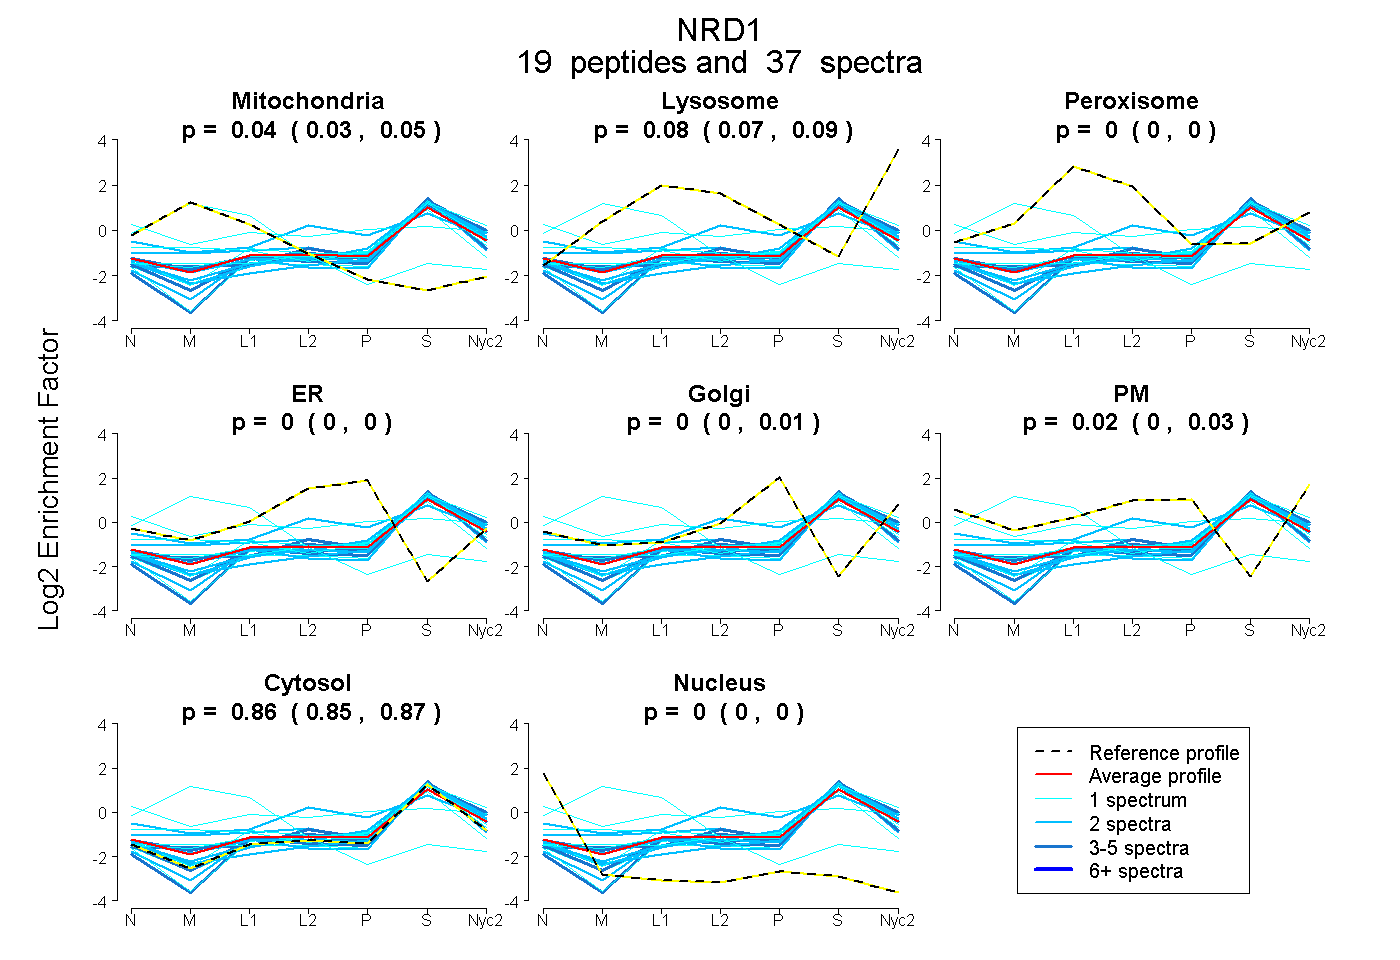
0.028 | 0.051
0.069 | 0.092
0.000 | 0.005
0.000 | 0.000
0.000 | 0.008
0.000 | 0.032
0.847 | 0.867
0.000 | 0.000
6peptides
spectra
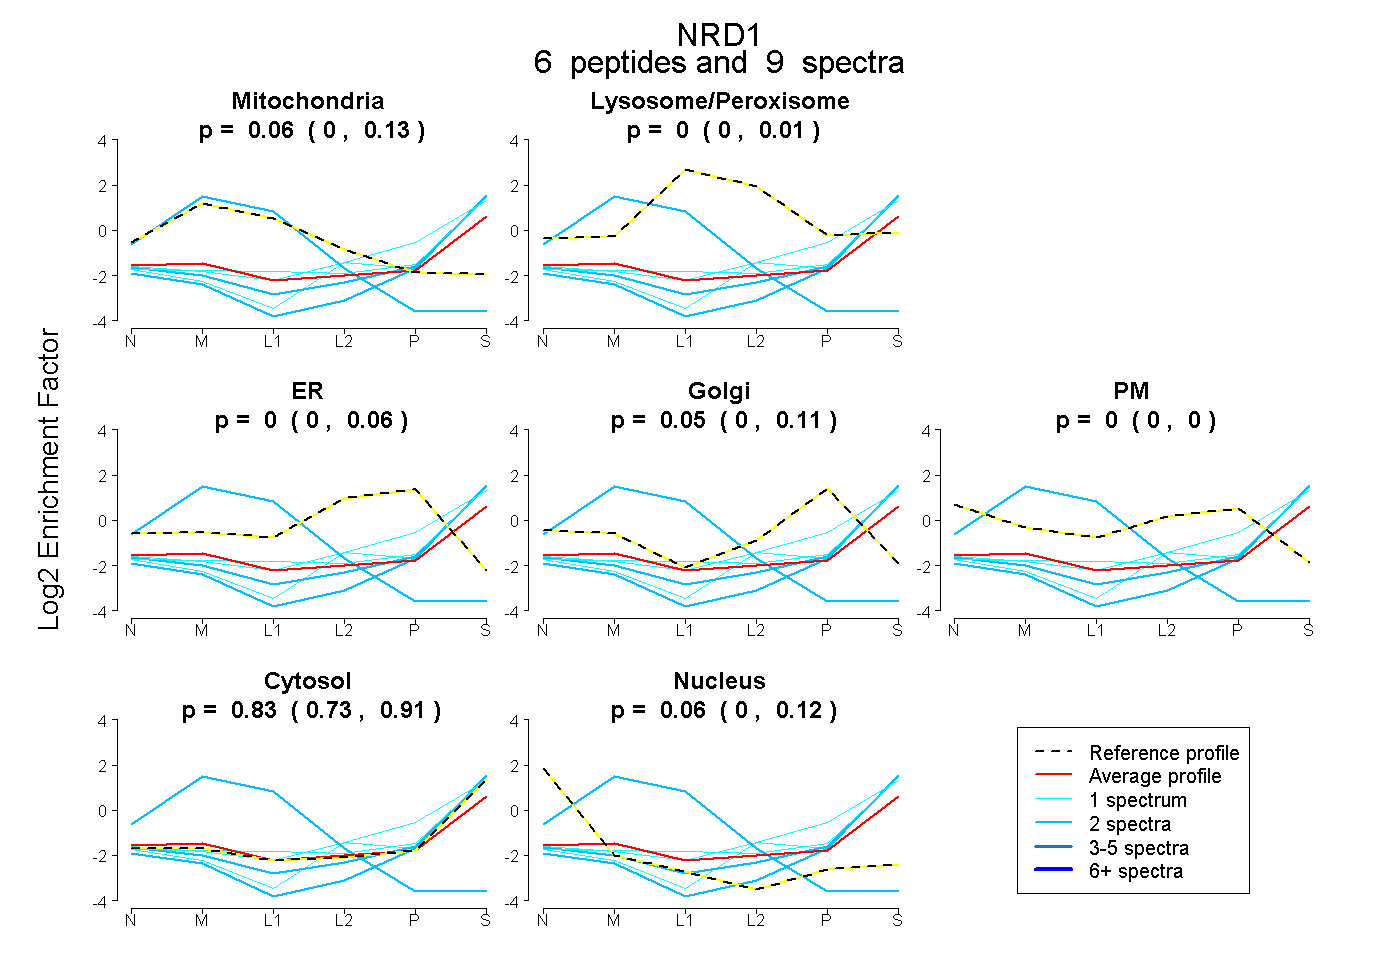
0.000 | 0.129
0.000 | 0.009
0.000 | 0.061
0.000 | 0.110
0.000 | 0.000
0.729 | 0.910
0.000 | 0.119
11peptides
spectra
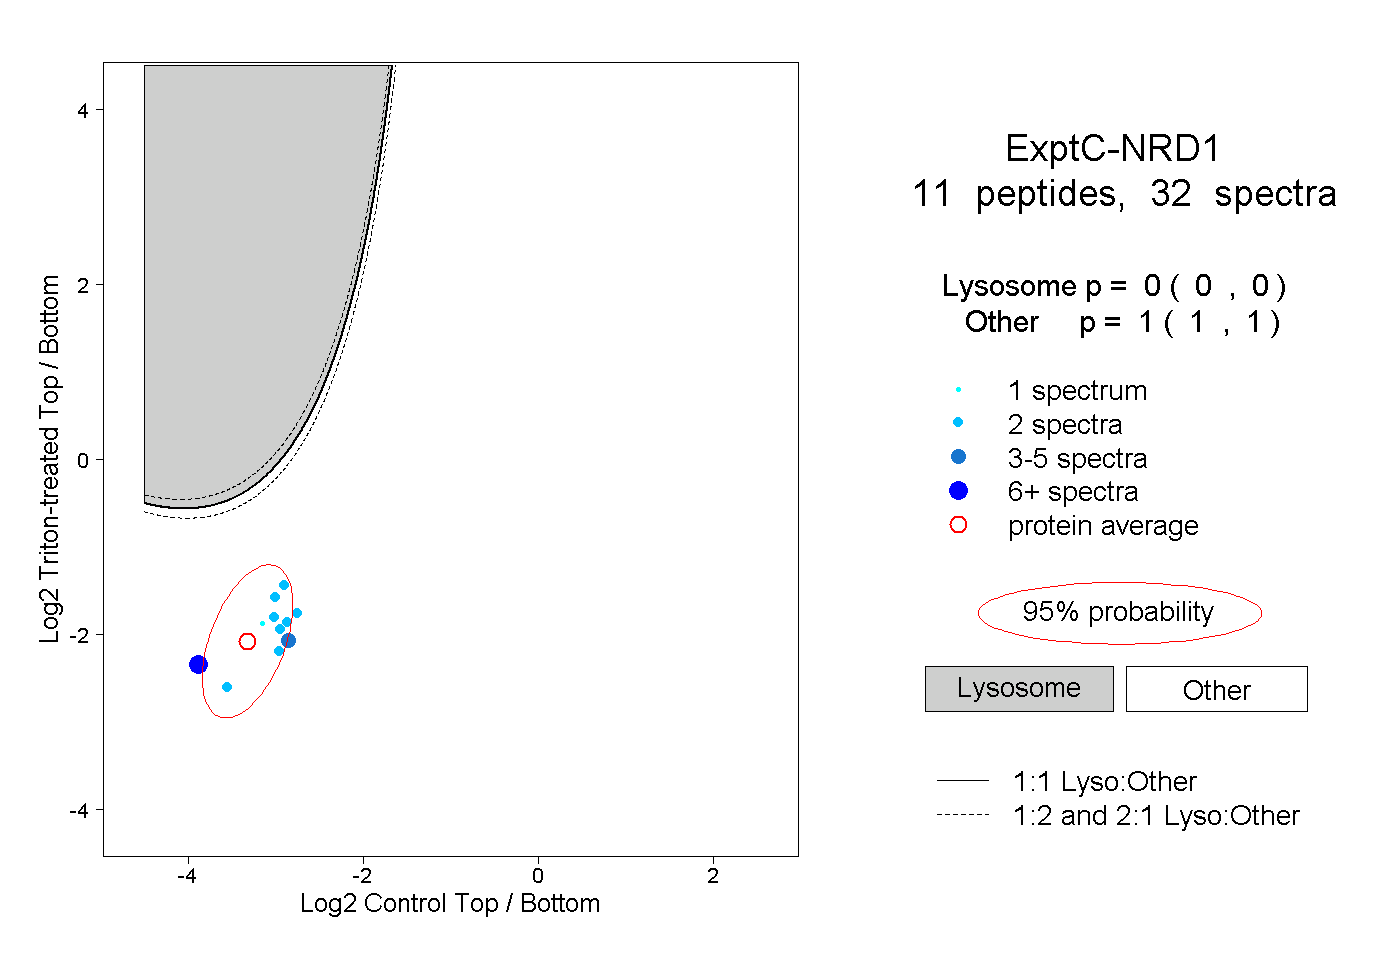
0.000 | 0.000
1.000 | 1.000
2peptides
spectra
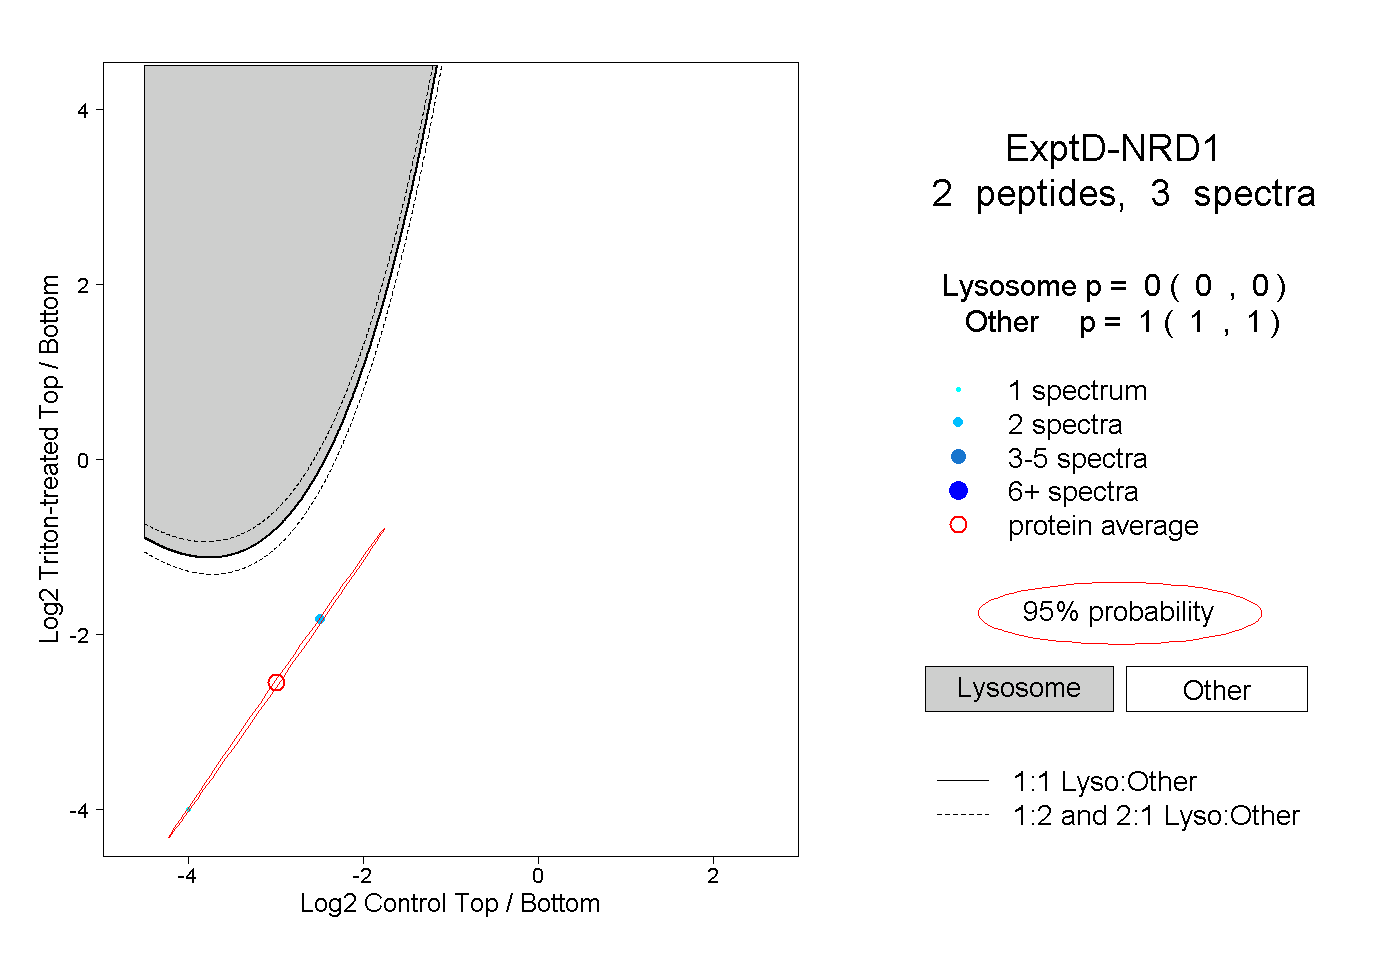
0.000 | 0.000
1.000 | 1.000