NRD1
[ENSRNOP00000010462]
Main page
| | | Plot |
Mito |
Lyso |
|
Perox |
ER |
Golgi |
PM |
Cytosol |
Nucleus |
|
| Expt A |
 19
19
peptides |
37
spectra |
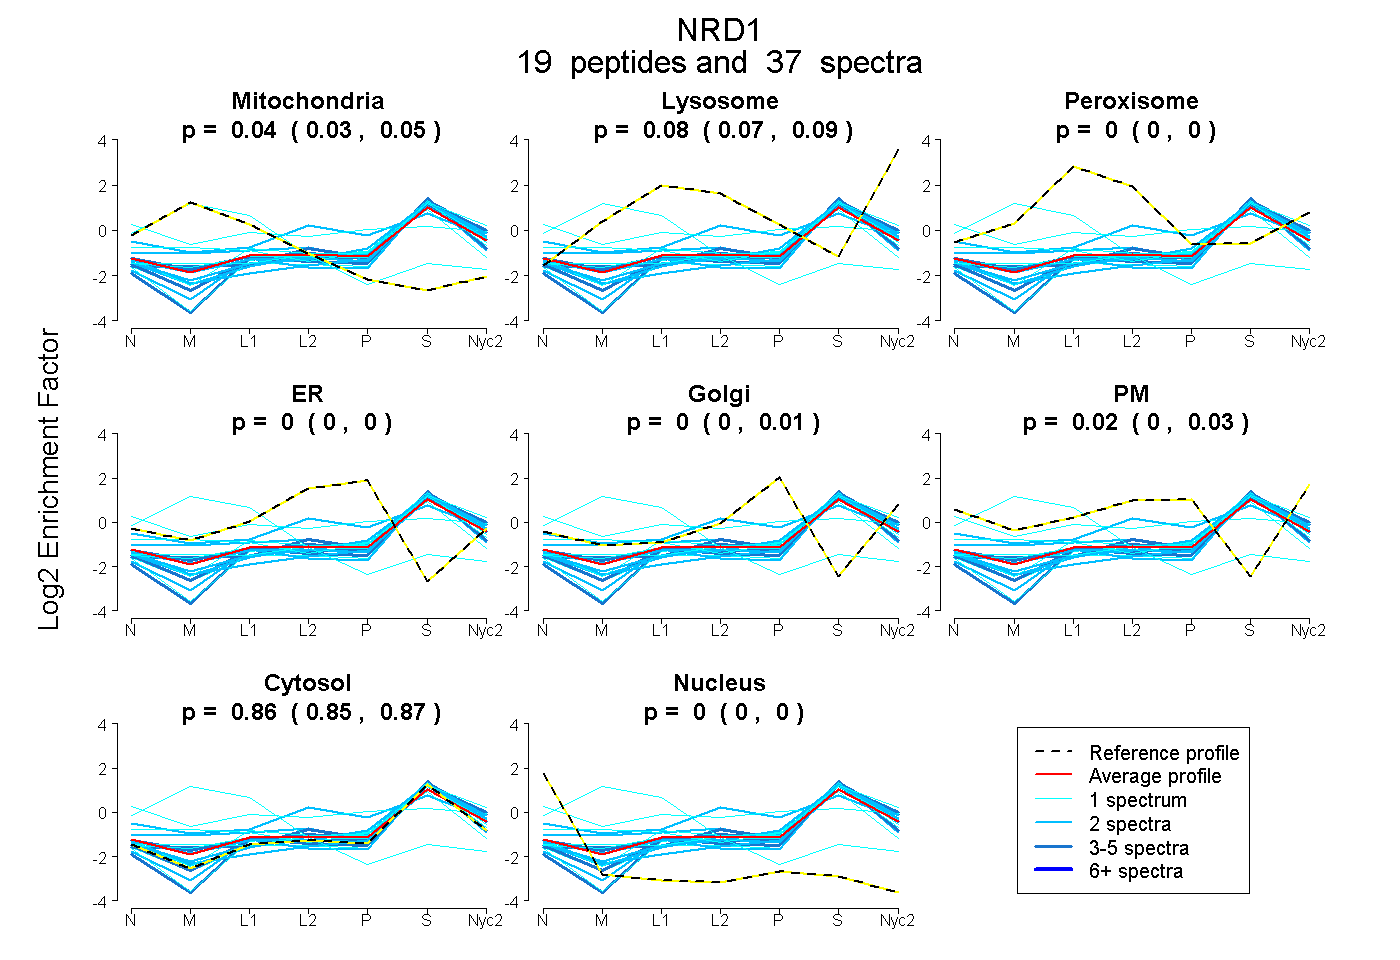 |
0.040
0.028 | 0.051 |
0.082
0.069 | 0.092 |
|
0.000
0.000 | 0.005 |
0.000
0.000 | 0.000 |
0.000
0.000 | 0.008 |
0.020
0.000 | 0.032 |
0.858
0.847 | 0.867 |
0.000
0.000 | 0.000 |
|
| | | Plot |
Mito |
|
Lyso or Perox |
|
ER |
Golgi |
PM |
Cytosol |
Nucleus |
|
| Expt B |
6
peptides |
9
spectra |
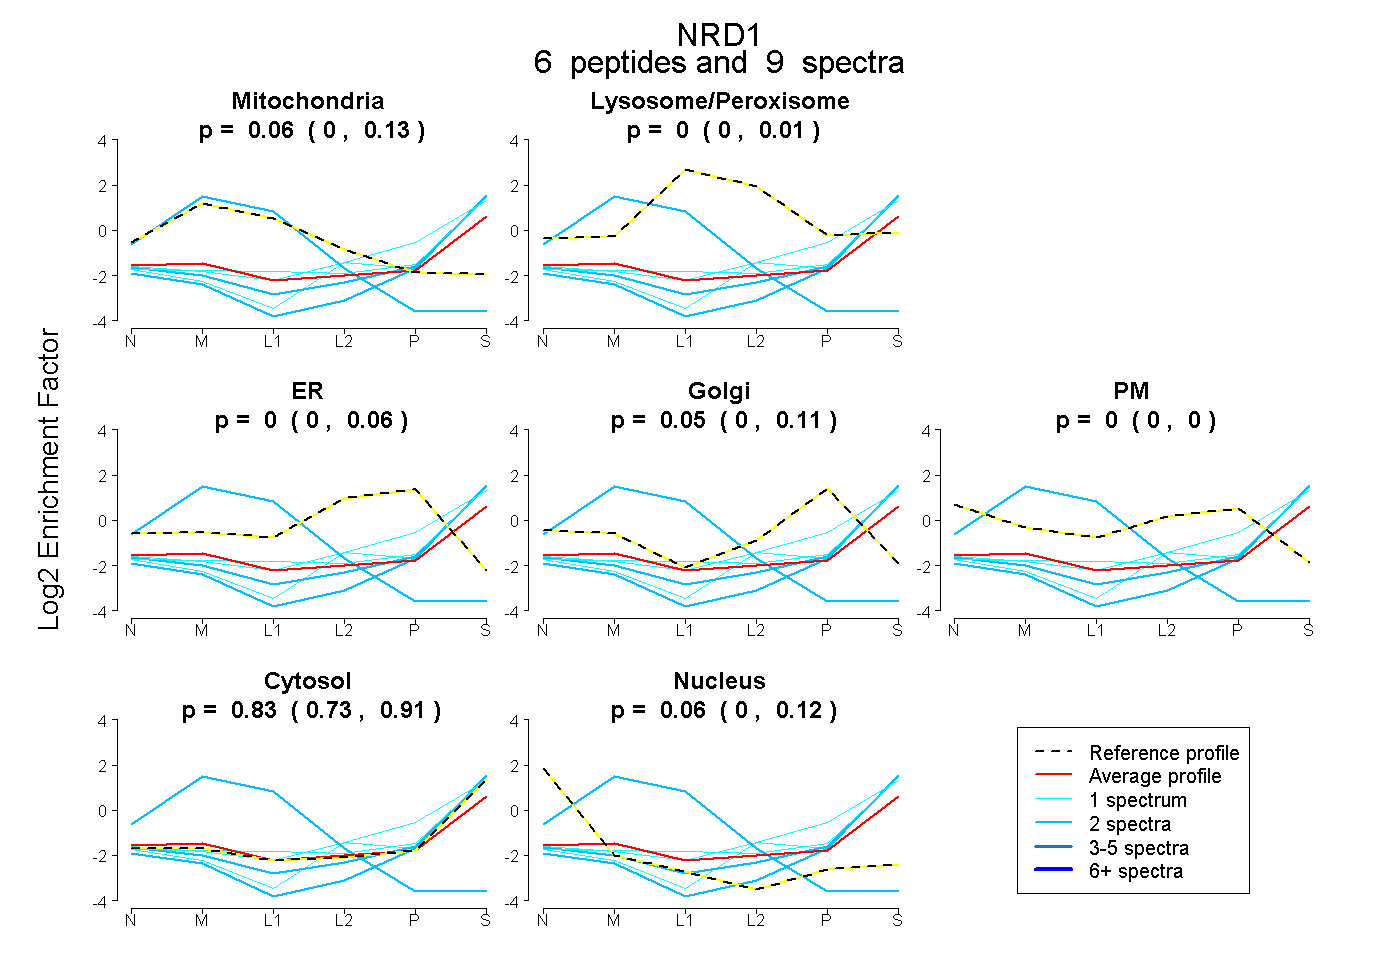 |
0.063
0.000 | 0.129 |
|
0.000
0.000 | 0.009 |
|
0.000
0.000 | 0.061 |
0.047
0.000 | 0.110 |
0.000
0.000 | 0.000 |
0.829
0.729 | 0.910 |
0.061
0.000 | 0.119 |
|
| 1 spectrum, LNFVPLER |
0.000 |
|
0.000 |
|
0.111 |
0.068 |
0.000 |
0.821 |
0.000 |
|
| 1 spectrum, GSILSYLR |
0.000 |
|
0.000 |
|
0.000 |
0.000 |
0.000 |
1.000 |
0.000 |
|
| 1 spectrum, LVAGEHGLIIR |
0.000 |
|
0.057 |
|
0.000 |
0.000 |
0.000 |
0.943 |
0.000 |
|
| 2 spectra, LLILEYSR |
0.000 |
|
0.000 |
|
0.000 |
0.000 |
0.000 |
0.989 |
0.011 |
|
| 2 spectra, LGADESEEEGR |
0.000 |
|
0.000 |
|
0.000 |
0.000 |
0.000 |
0.969 |
0.031 |
|
| 2 spectra, VVPIR |
0.939 |
|
0.000 |
|
0.000 |
0.000 |
0.000 |
0.000 |
0.061 |
|
| | | Plot |
|
Lyso |
|
|
|
|
|
|
|
Other |
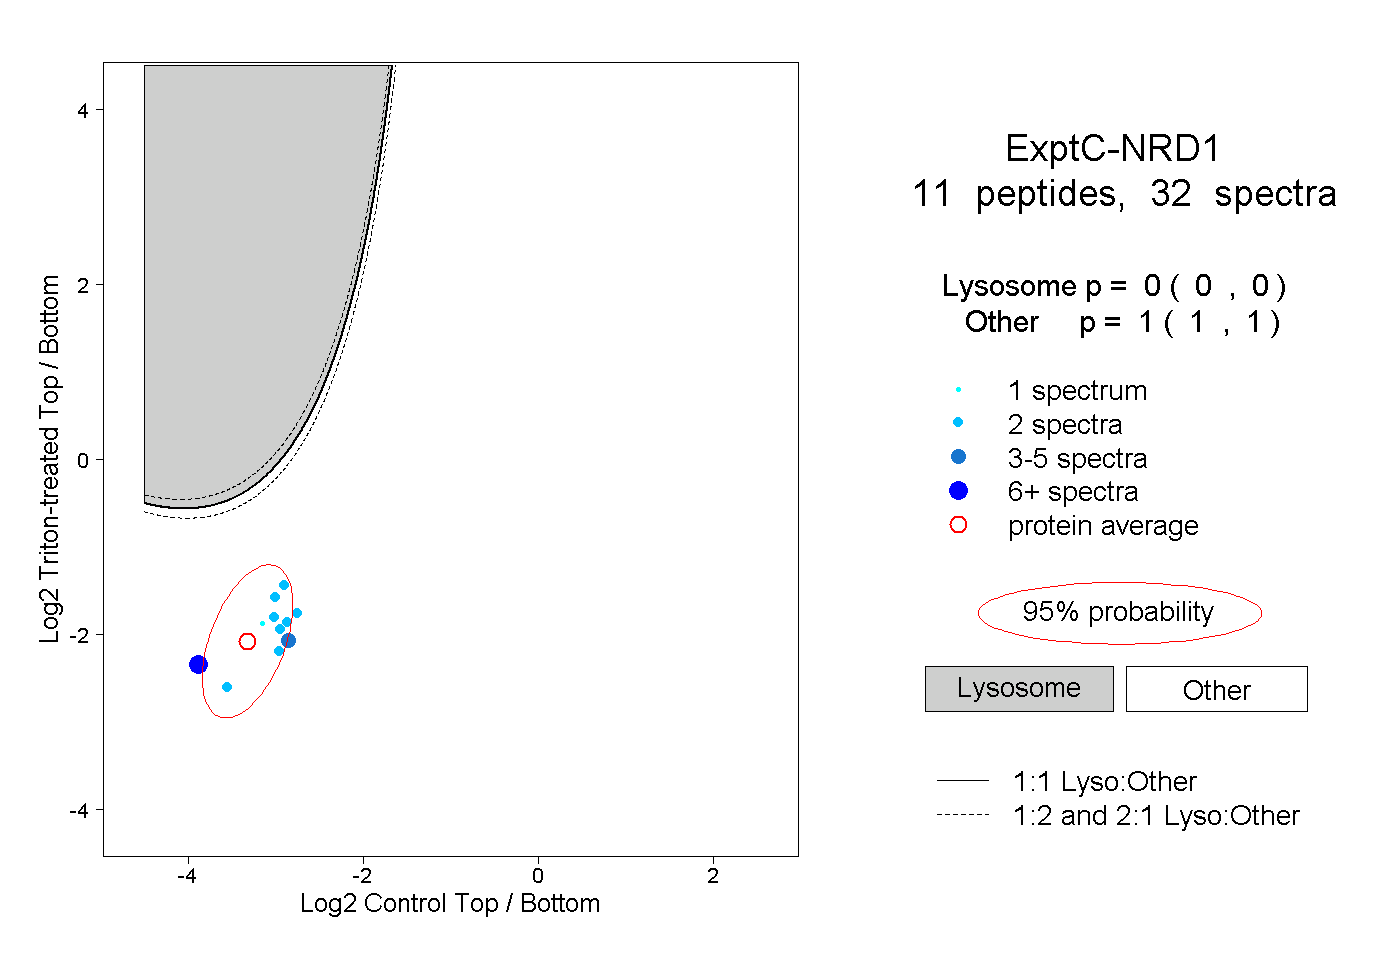
| Expt C |
11
peptides |
32
spectra |
 |
|
0.000
0.000 | 0.000 |
|
|
|
|
|
|
|
1.000
1.000 | 1.000 |
| | | Plot |
|
Lyso |
|
|
|
|
|
|
|
Other |
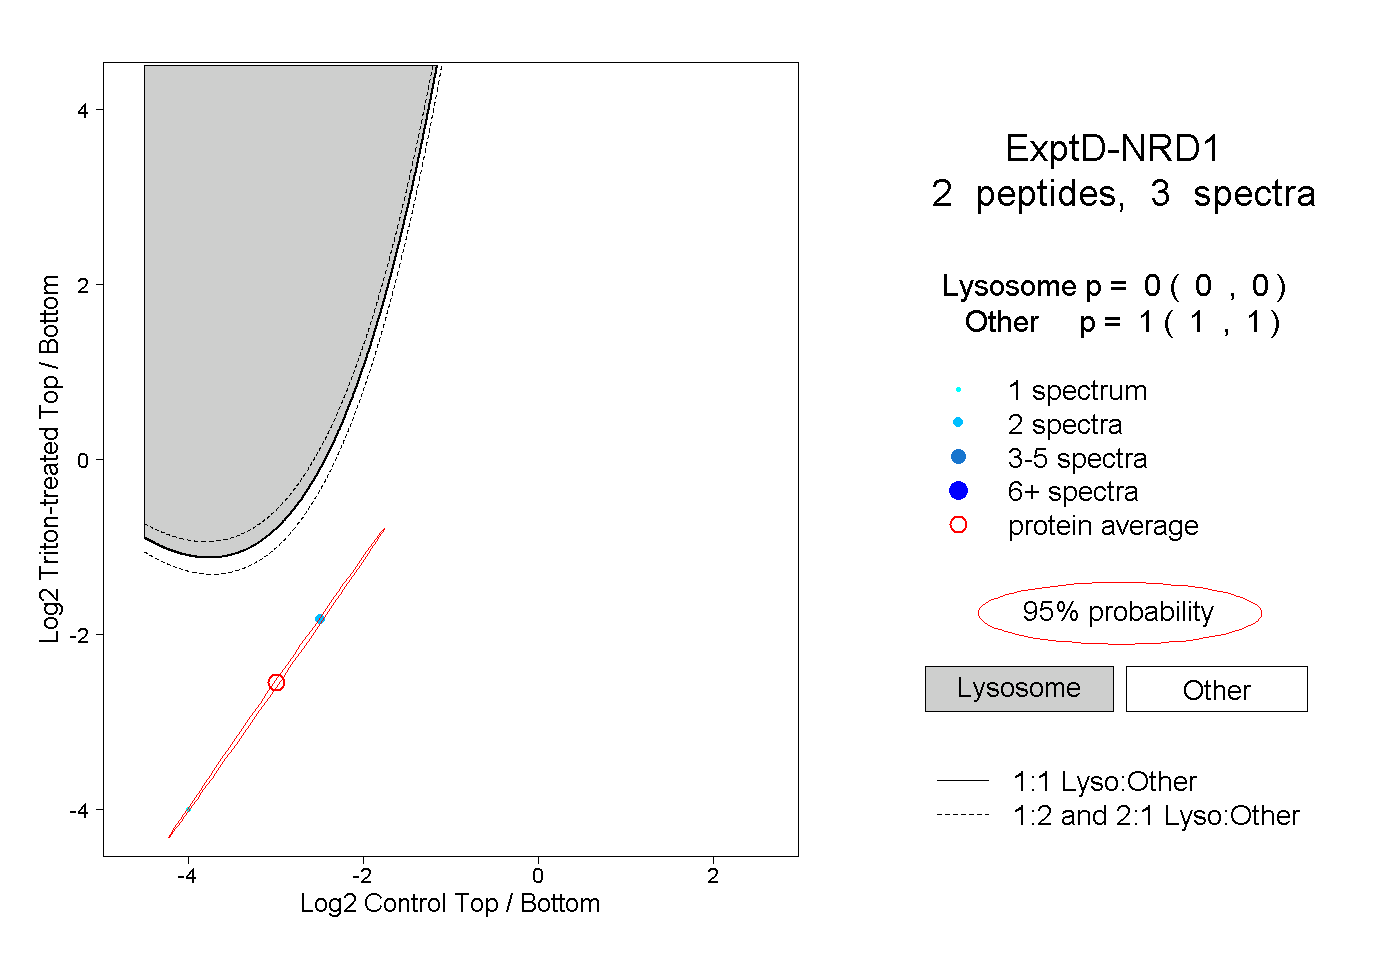
| Expt D |
2
peptides |
3
spectra |
 |
|
0.000
0.000 | 0.000 |
|
|
|
|
|
|
|
1.000
1.000 | 1.000 |