 14
14peptides
spectra
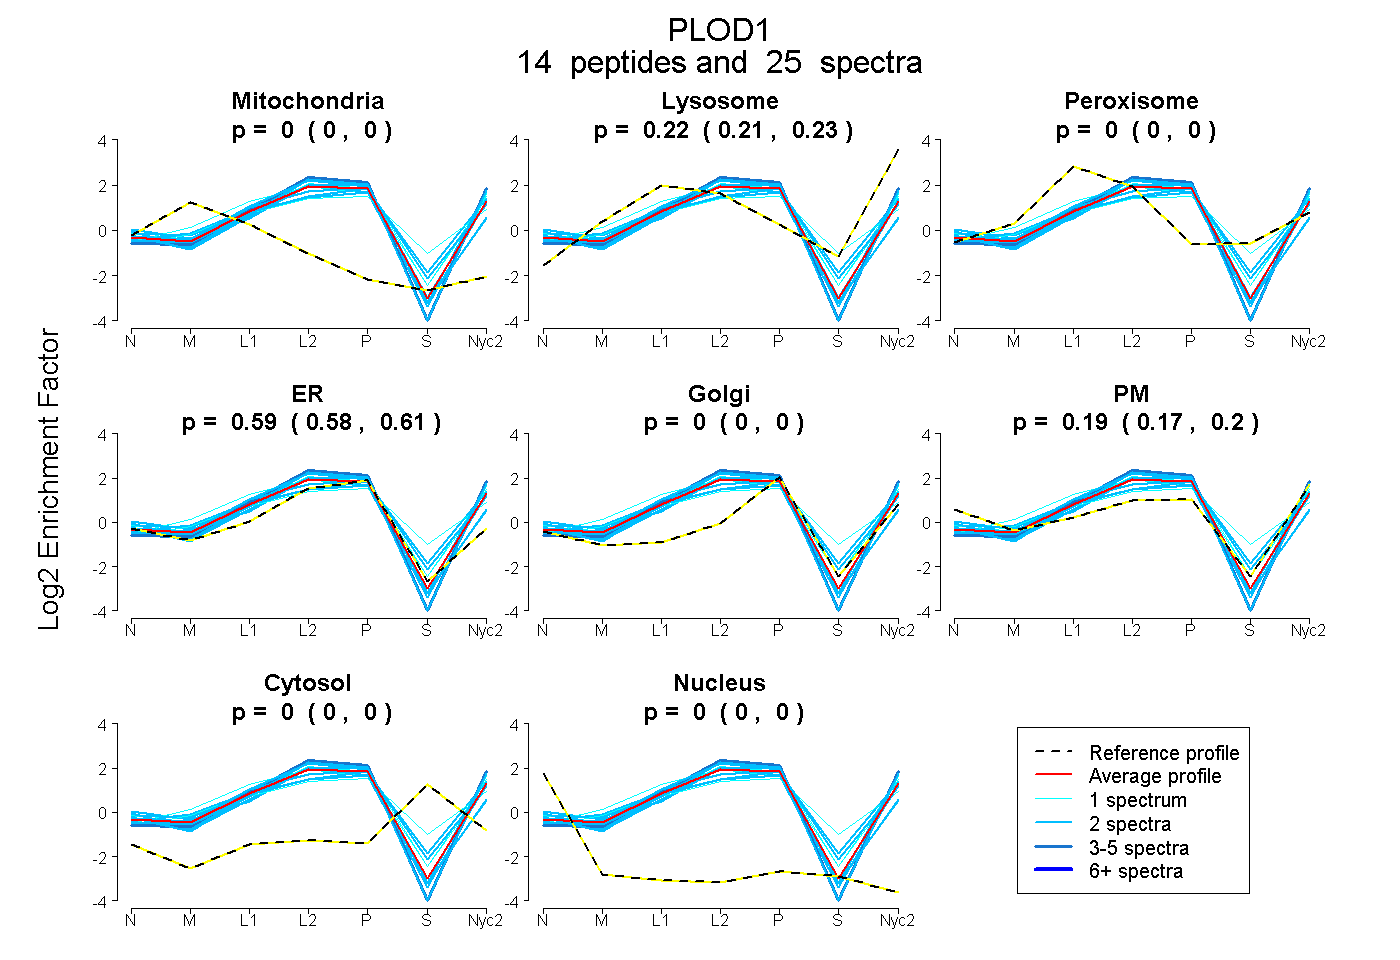
0.000 | 0.000
0.211 | 0.229
0.000 | 0.000
0.579 | 0.606
0.000 | 0.000
0.168 | 0.201
0.000 | 0.000
0.000 | 0.000
1peptide
spectrum
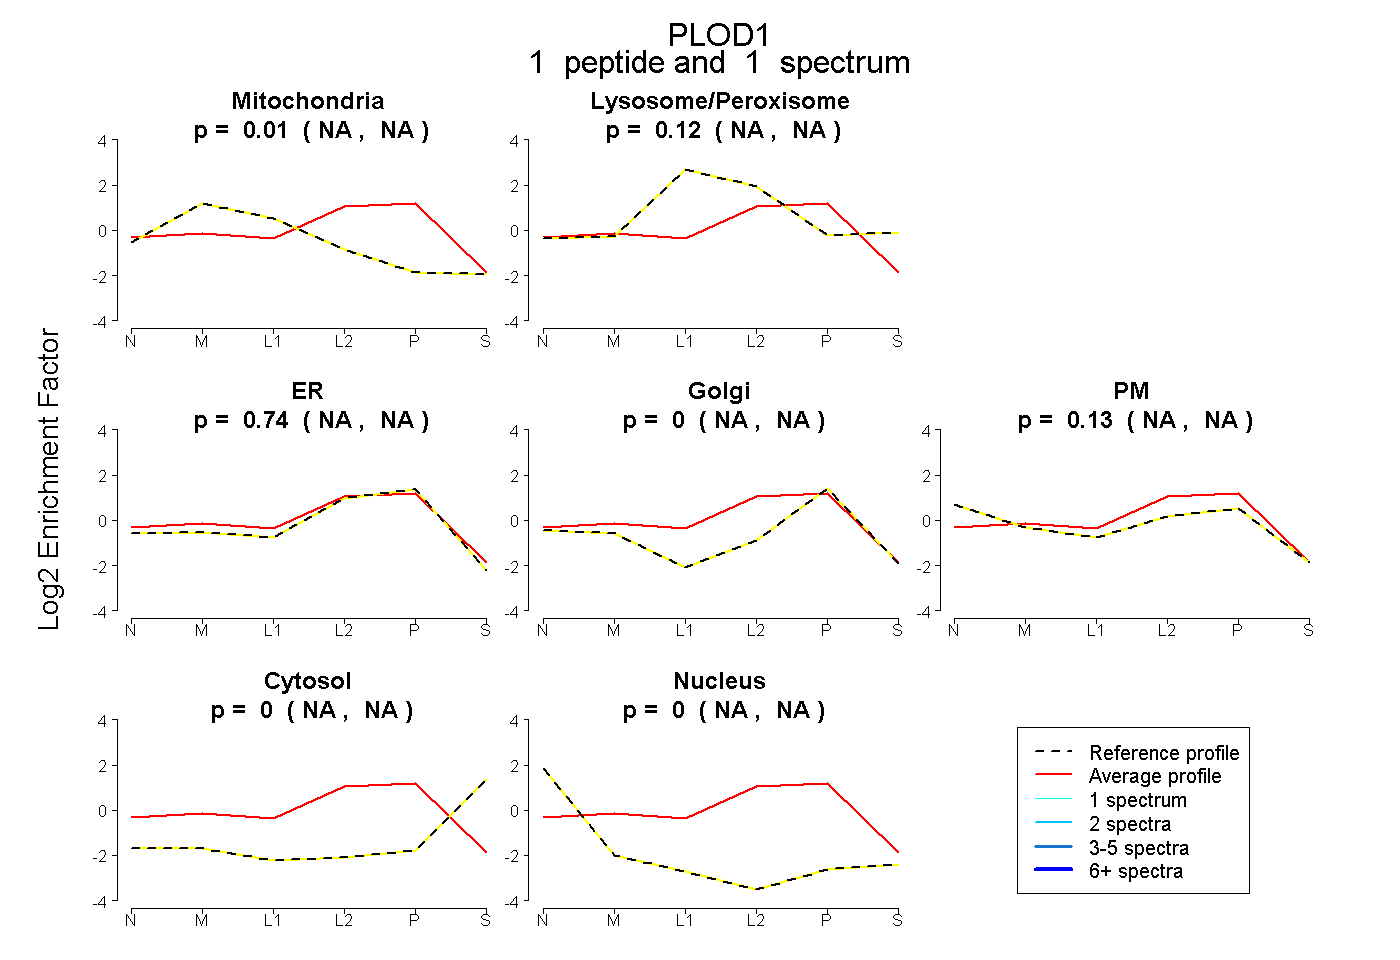
NA | NA
NA | NA
NA | NA
NA | NA
NA | NA
NA | NA
NA | NA
11peptides
spectra
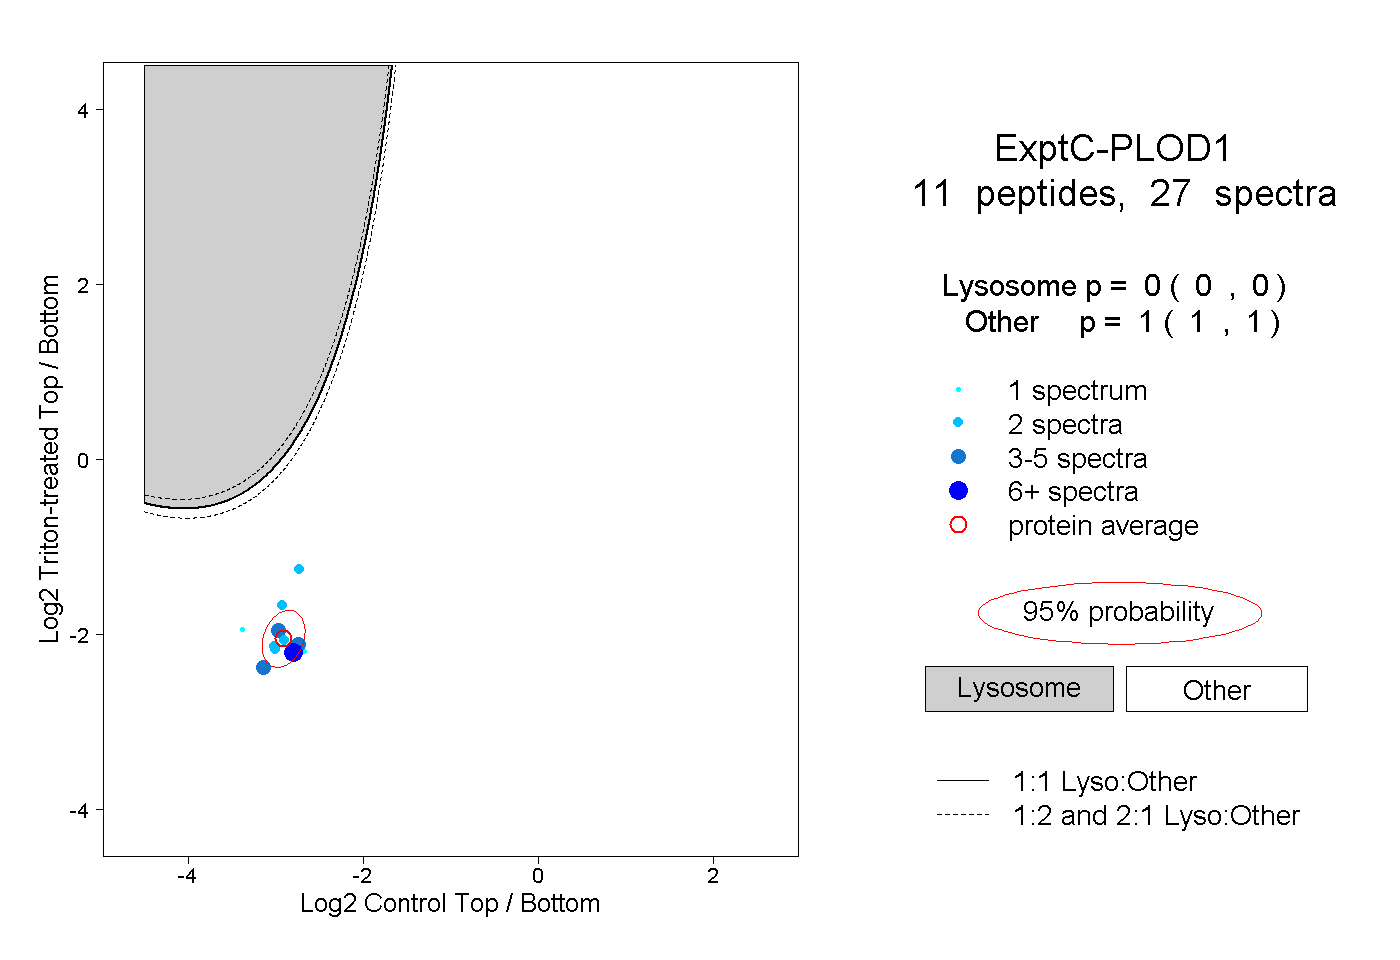
0.000 | 0.000
1.000 | 1.000
5peptides
spectra
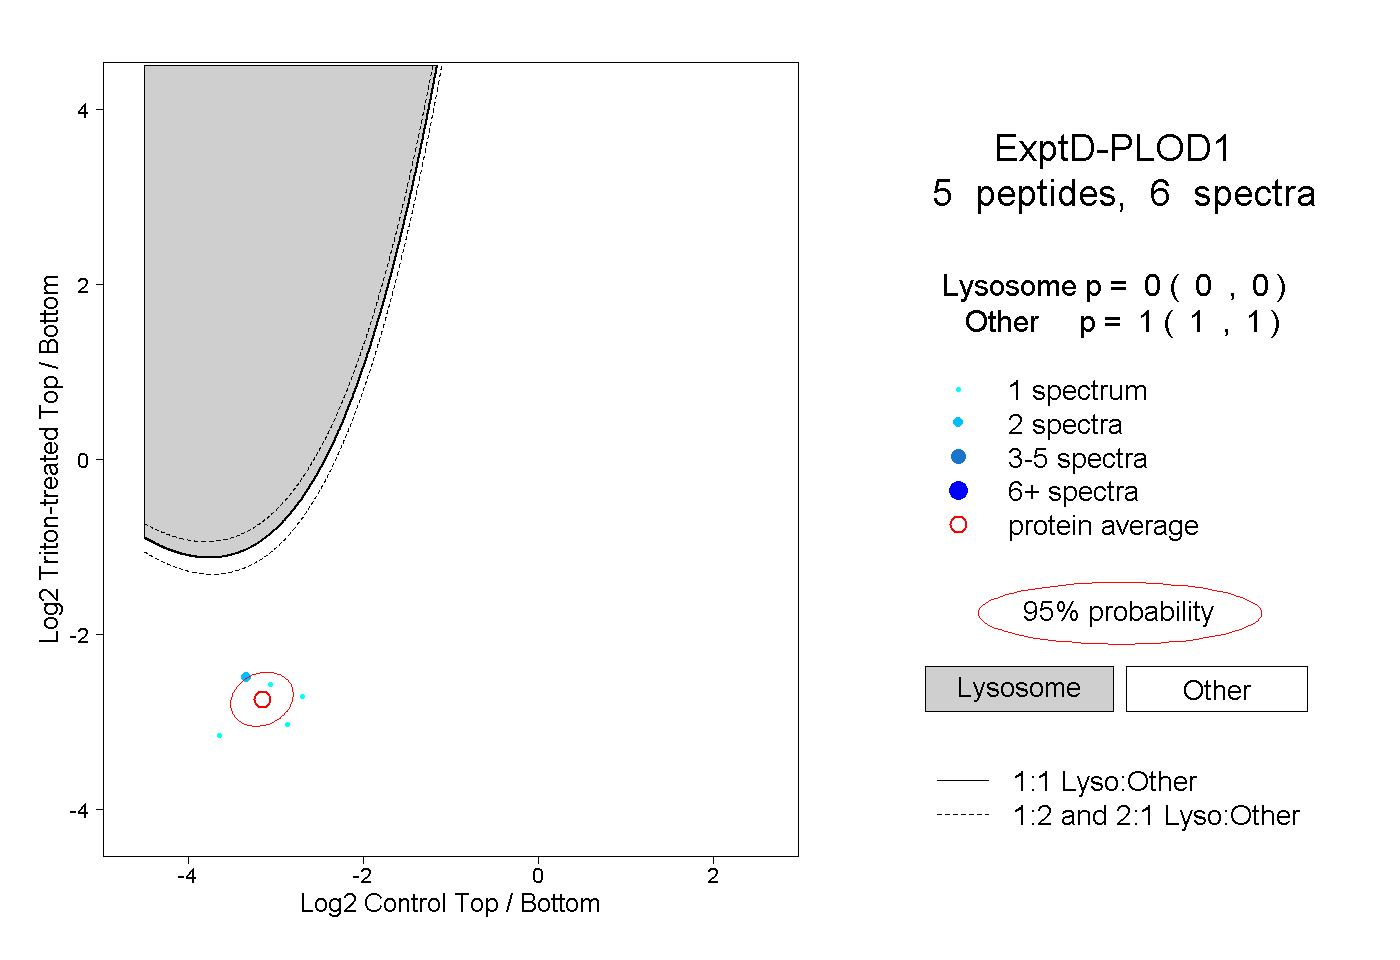
0.000 | 0.000
1.000 | 1.000