 14
14peptides
spectra
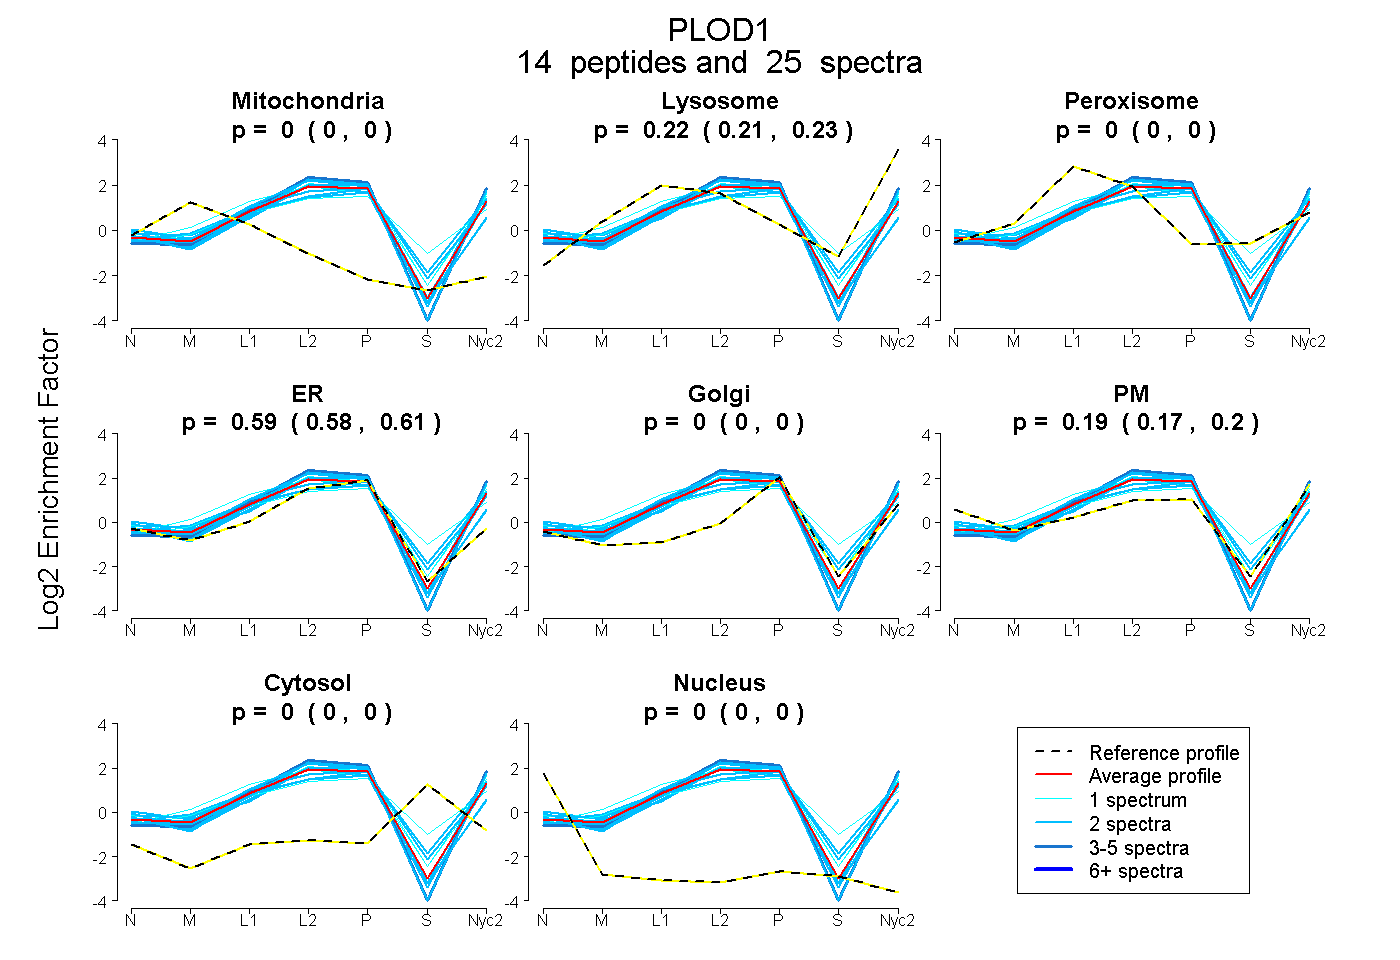
0.000 | 0.000
0.211 | 0.229
0.000 | 0.000
0.579 | 0.606
0.000 | 0.000
0.168 | 0.201
0.000 | 0.000
0.000 | 0.000
| Plot | Mito | Lyso | Perox | ER | Golgi | PM | Cytosol | Nucleus | |||||
| Expt A |
14 peptides |
25 spectra |
|
0.000 0.000 | 0.000 |
0.220 0.211 | 0.229 |
0.000 0.000 | 0.000 |
0.593 0.579 | 0.606 |
0.000 0.000 | 0.000 |
0.187 0.168 | 0.201 |
0.000 0.000 | 0.000 |
0.000 0.000 | 0.000 |
| 2 spectra, LQVNYLGNYIPR | 0.000 | 0.142 | 0.000 | 0.437 | 0.000 | 0.420 | 0.000 | 0.000 | ||
| 2 spectra, LEDNLLVLTVATK | 0.000 | 0.121 | 0.000 | 0.489 | 0.000 | 0.390 | 0.000 | 0.000 | ||
| 1 spectrum, LLIEQNK | 0.000 | 0.283 | 0.000 | 0.547 | 0.000 | 0.170 | 0.000 | 0.000 | ||
| 2 spectra, VGEDYEGGGCR | 0.000 | 0.115 | 0.000 | 0.852 | 0.000 | 0.033 | 0.000 | 0.000 | ||
| 1 spectrum, LTHYHEGLPTTK | 0.000 | 0.118 | 0.264 | 0.301 | 0.217 | 0.070 | 0.031 | 0.000 | ||
| 3 spectra, NVIAPLMTR | 0.000 | 0.244 | 0.000 | 0.589 | 0.000 | 0.167 | 0.000 | 0.000 | ||
| 2 spectra, FLVEYIAPLTEK | 0.000 | 0.286 | 0.000 | 0.567 | 0.000 | 0.146 | 0.000 | 0.000 | ||
| 1 spectrum, LFIHNQEQHHK | 0.000 | 0.386 | 0.016 | 0.597 | 0.000 | 0.000 | 0.000 | 0.000 | ||
| 1 spectrum, LVGPEVR | 0.000 | 0.251 | 0.000 | 0.598 | 0.000 | 0.152 | 0.000 | 0.000 | ||
| 2 spectra, SEDYVDIVQGR | 0.000 | 0.200 | 0.000 | 0.491 | 0.000 | 0.309 | 0.000 | 0.000 | ||
| 2 spectra, SAQFFNYK | 0.000 | 0.227 | 0.000 | 0.591 | 0.000 | 0.182 | 0.000 | 0.000 | ||
| 2 spectra, LYPGYYTK | 0.000 | 0.202 | 0.000 | 0.540 | 0.000 | 0.258 | 0.000 | 0.000 | ||
| 2 spectra, LDPDMSFCANVR | 0.000 | 0.196 | 0.000 | 0.804 | 0.000 | 0.000 | 0.000 | 0.000 | ||
| 2 spectra, QQEVFMFLTNR | 0.000 | 0.260 | 0.000 | 0.564 | 0.000 | 0.177 | 0.000 | 0.000 |
| Plot | Mito | Lyso or Perox | ER | Golgi | PM | Cytosol | Nucleus | ||||||
| Expt B |
1 peptide |
1 spectrum |
 |
0.007 NA | NA |
0.121 NA | NA |
0.744 NA | NA |
0.000 NA | NA |
0.128 NA | NA |
0.000 NA | NA |
0.000 NA | NA |
|||
| Plot | Lyso | Other | |||||||||||
| Expt C |
11 peptides |
27 spectra |
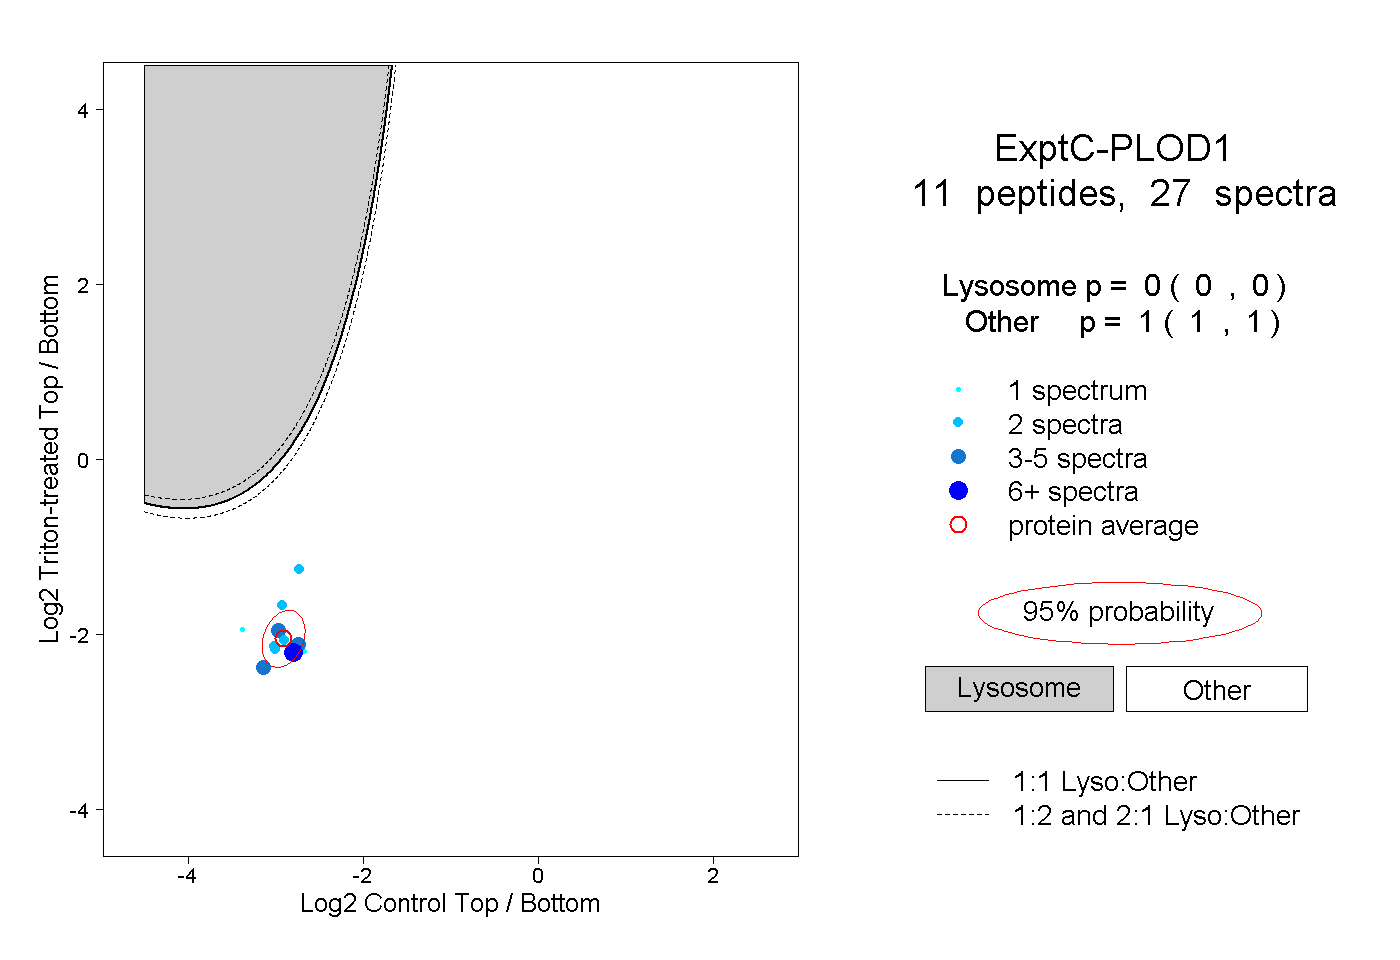 |
0.000 0.000 | 0.000 |
1.000 1.000 | 1.000 |
||||||||
| Plot | Lyso | Other | |||||||||||
| Expt D |
5 peptides |
6 spectra |
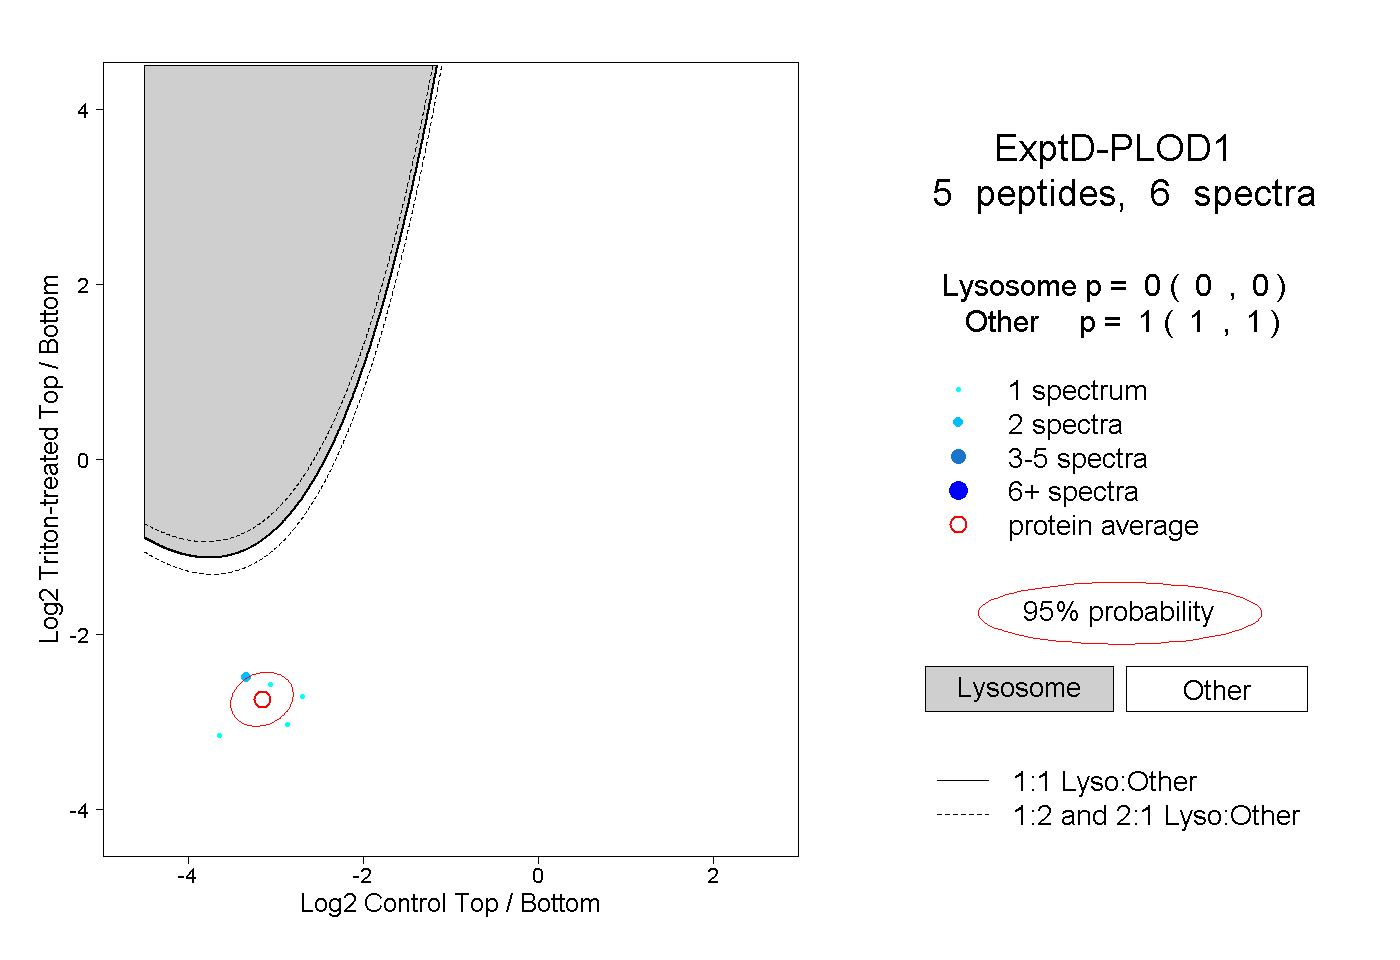 |
0.000 0.000 | 0.000 |
1.000 1.000 | 1.000 |